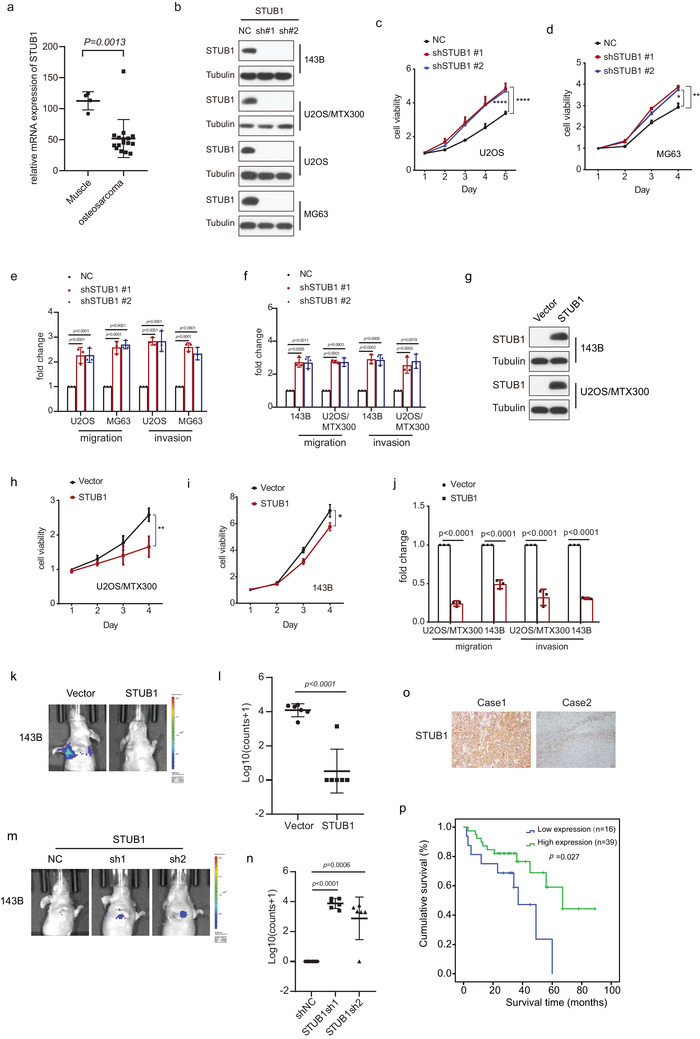
Figure 3.

STUB1 acts as a tumor suppressor in osteosarcoma. a) The statistical results of STUB1 mRNA levels from our RNA‐seq data for 16 osteosarcoma tissues and 4 muscle tissues are shown. The data are presented as the mean ± SD. A two‐sided unpaired student's t‐test was performed, and p values are shown. b,g) The indicated stable cells were subjected to western blot analysis. The experiments were repeated three times independently with similar results. c,d,h,i) Cell viability was analyzed by MTT assay in the indicated stable cells. The depicted results are the averages of at least three independent experiments. The data are presented as the mean ± SD. Two‐way ANOVA test was performed, and p values are shown. *p < 0.05, **p < 0.01, ****p < 0.0001. e,f,j) Quantification analyses of migration and invasion assays using the indicated stable cell lines. The depicted results are the averages of at least three independent experiments. A two‐sided unpaired student's t‐test was performed, and p values are shown. k–n) The orthotropic osteosarcoma metastasis model in vivo using the indicated stable cell lines (n = 6 biologically independent animals). k,m) Representative images of mice. l,n) Quantification analyses of images. The data are presented as the mean ± SD. A two‐sided unpaired student's t‐test was performed, and p values are shown. o) Representative immunohistochemical staining images of STUB1 for 55 paraffin‐embedded osteosarcoma tissues. Scale bar: 100 µm. p) Overall survival curves were generated based on the protein levels of STUB1 in the osteosarcoma tissues using Kaplan–Meier plots. The Log‐rank test was performed, and p values are shown.
