FIGURE 10.
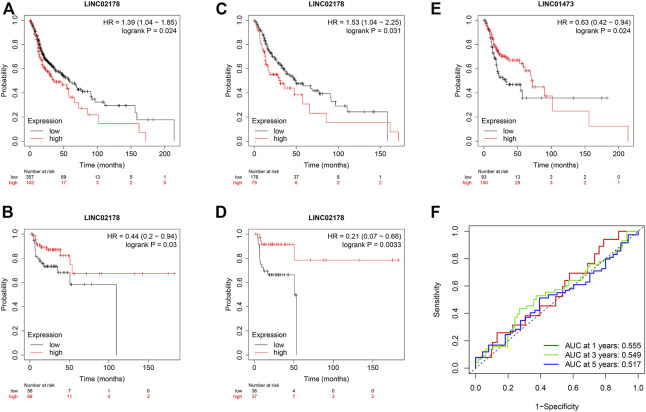
(A–E) Prognostic value of LINC02178 and LINC01473 based on Kaplan–Meier plotter. (A) Kaplan-Meier curve to show OS of patients in different LINC02178 expression levels. (B) Kaplan-Meier curve to show RFS of patients in different LINC02178 expression levels. (C) Kaplan-Meier curve to show OS of patients with high-TMB in different LINC02178 expression levels. (D) Kaplan-Meier curve to show RFS of patients with low-TMB in different LINC02178 expression levels. (E) Kaplan-Meier curve to show OS of patients with low-TMB in different LINC01473 expression levels. (F) Prognostic value of CRLs based on TCGA-CESC.

