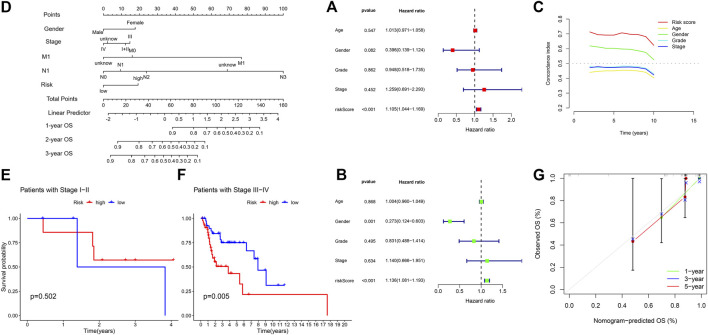
FIGURE 6.
(A) Univariate Cox regression analysis between prognostic signatures and overall survival. (B) Multivariate cox regression analysis between prognostic signatures and overall survival. (C) The concordance index of different clinical characteristics and risk scores. (D) Nomogram of prognostic factors to predict the 1-, 3- and 5-years survival rates of patients with HNSC. (E) Kaplan-Meier curve to show overall survival of patients with early stage I-II tumor in different risk groups. (F) Kaplan-Meier curve to show overall survival of patients with late-stage III-IV tumor in different risk groups. (G) The calibration curves between the prediction by nomogram and actual survival.

