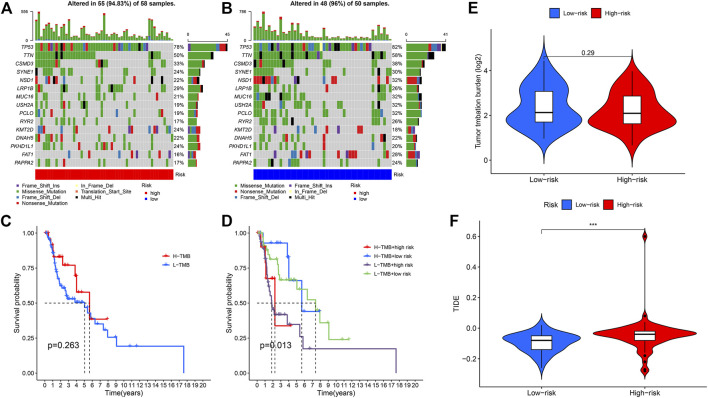
FIGURE 9.
(A) Mutation rates and types of top 15 genes in the high-risk group. (B) Mutation rates and types of top 15 genes in the low-risk group. (C) Kaplan-Meier curve to show survival of patients in different TMB groups. (D) Kaplan-Meier curve to show survival of patients in different TMB and risk groups. (E) TMB between high and low risk groups. (F) TIDE value between high and low risk groups (***p < 0.001).

