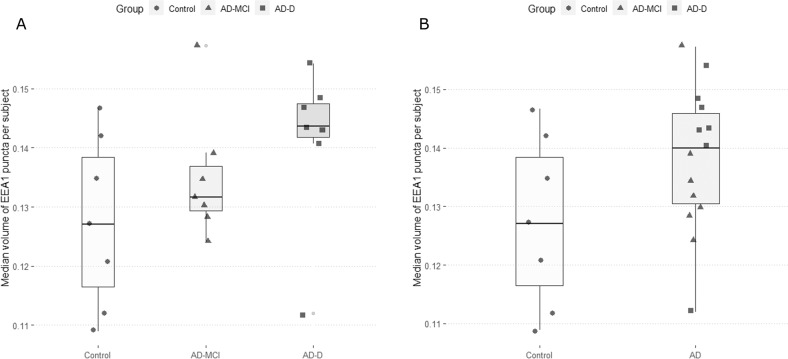
Fig. 1. EEA1 positive puncta volumes in fibroblasts of controls, AD-MCI and AD-D.
A Controls are represented as circles and their quartile distribution as a white-colored boxplot, AD-MCI are represented as triangles and AD-D as squares, their respective quartile boxplots are in light and dark grey. B Pooled AD subjects are represented as triangles for AD-MCI and squares for AD-D and their pooled quartile distribution is represented in light grey.

