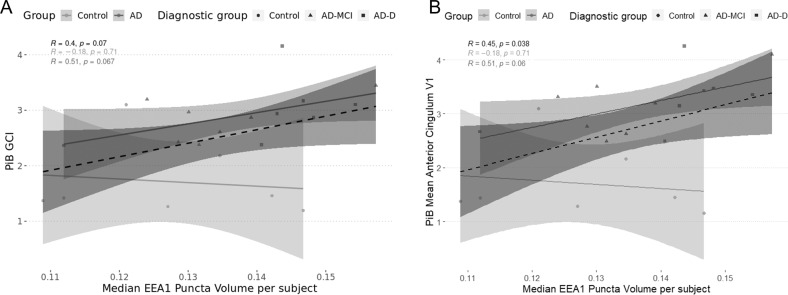
Fig. 4. Graphical representations of the correlations between PiB retention and the median EEA1 positive puncta volume.
For all cases, circles represent controls, triangles represent AD-MCI, and squares represent AD-D. Likewise, the total correlation is represented as a dashed line in dark-grey and its 95% confidence interval is represented in the shaded dark grey area. The stratified correlations according to disease group are in grey (AD) and light grey (Control). Correlation values are on the graph, with the total correlation being in black, the correlation for controls in light grey, and the correlations for AD in dark grey. A shows correlations between global PiB retention and EEA1 positive puncta volume, B presents correlations between PiB retention in the anterior cingulum and EEA1 positive puncta volume.

