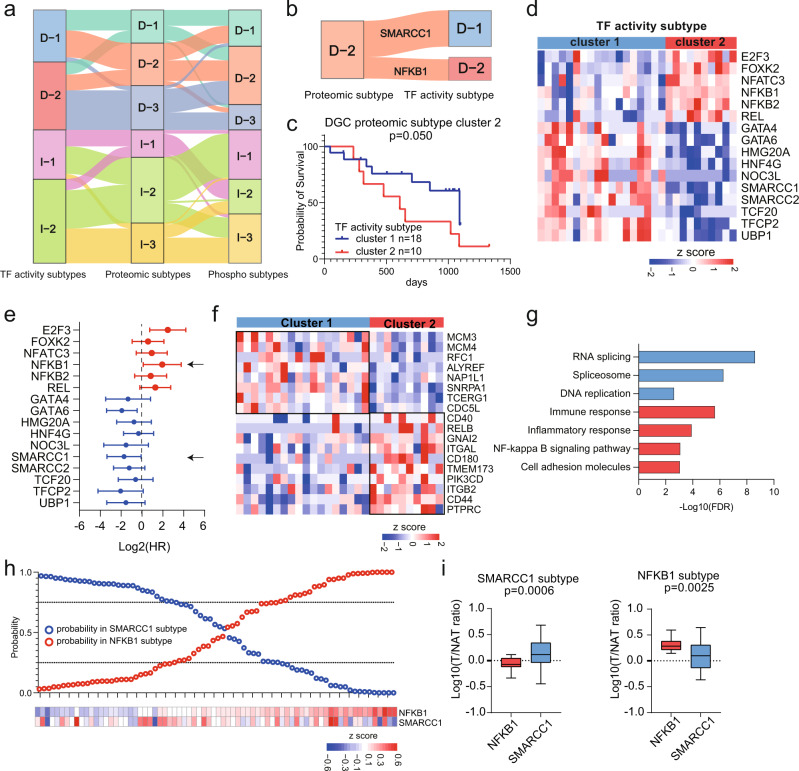
Fig. 6. Characteristics of Multilevel Proteomic Subtyping and its Robustness.
a Sankey diagram depicting the association of samples classified into TF activity, proteome and phospho-proteome-based subtypes. b Sankey diagram depicting the association of samples classified into DGC proteomic cluster 2 and DGC TF subtypes. c Prognostic outcomes of GC patients in DGC proteomic subtype cluster 2. n (cluster 1) = 18 and n (cluster 2) = 10 biologically independent samples. The p-value is from Log-rank test. d TF activities comparison between two TF activity subtypes. e Prognostic outcomes of TFs with significantly differential activities in two TF activity subtypes. n = 28 biologically independent samples. The points and error bars show the median of hazard ratio (HR) and 95% confidence interval (CI). f Proteins expression of target genes of two TFs. g Pathways enriched in two subgroups of DGC proteomic subtype cluster 2. h Performance of the TF subtype predictor based on NFKB1 and SMARCC1. i The expression of NFKB1 and SMARCC1 in two subgroups. n (SMARCC1 subtype) = 28 and n (NFKB1 subtype) = 24 biologically independent samples. Boxplots show median (central line), upper and lower quartiles (box limits), min to max range. The p-value is calculated using two-sided student’s t-test. Source data are provided as a Source Data file.

