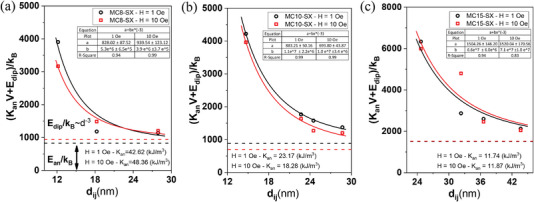
Figure 10.

Dependence of the energy barrier formed by the sum of the anisotropy energy (E A) and the magnetic dipole interaction energy (E D) on the interparticle distance, dij, and thus on the strength of the dipole interactions of a) MC8‐SX, b) MC10‐SX, and c) MC15‐SX MNPs at 1 Oe (black pattern) and 10 Oe (red pattern). The symbols represent the energy barrier values obtained by plotting ln(f/f0) versus 1/TB based on Equation (11) and compiled in Table 1. The solid lines represent the fit of the energy barrier with the inter‐particle distance based on Equation (14). The inner box shows the values of “a” and “b” obtained in this fit, where “a” is the energy value obtained at the asymptotic limit (dij → ∞), represented by the dashed lines, which makes it possible to determine K eff‐D.Correction by decoupling the dipole interaction effects (E D = 0).
