Figure 2.

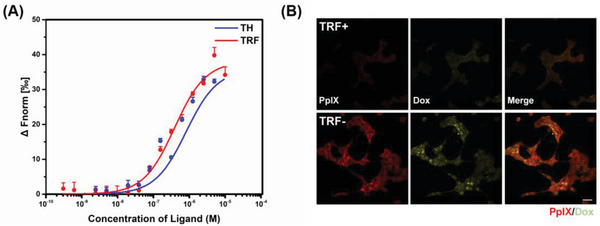
A) MST assay of binding affinity between TFRs and TH nano shell, TRF. B) CLSM images of ODP‐TH uptake in 4T1 cells treated with TRF (500 µm) for 4 h and unpretreated 4T1 cells. Mean ± SD, n = 3. Scale bar = 100 µm.

A) MST assay of binding affinity between TFRs and TH nano shell, TRF. B) CLSM images of ODP‐TH uptake in 4T1 cells treated with TRF (500 µm) for 4 h and unpretreated 4T1 cells. Mean ± SD, n = 3. Scale bar = 100 µm.