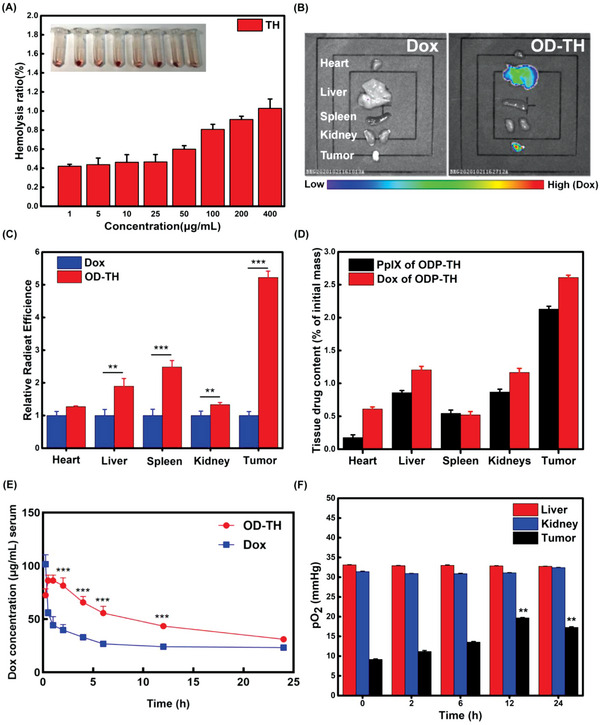
Figure 5.

A) Hemolysis rate of TH nano shell at different concentrations. B) In vivo fluorescence image of major organs and solid tumor 48 h after injection of OD‐TH. C) Relative fluorescence histogram of major organs and tumor 48 h after injection of Dox and OD‐TH. D) Distribution of PpIX and Dox in major organs (heart, liver, kidney, spleen) and solid tumor 48 h after injection of ODP‐TH. E) Pharmacokinetics analysis of single loaded OD‐TH and free Dox in serum of 4T1 tumor bearing mice at 0.25, 0.5, 1, 2, 4, 6, 12, and 24 h after injection, i.v., with the dosage of 10 mg kg−1. F) Changes of pO2 in liver, kidney, and tumor of ODP‐TH treated mice at different time. Mean ± SD, n = 3. p‐values were indicated by ** (p < 0.01) and *** (p < 0.001).
