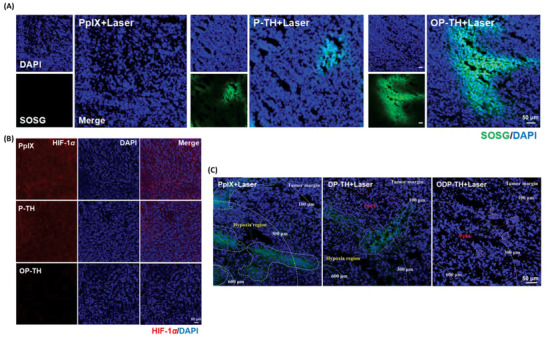
Figure 6.

A) CLSM images of SOSG (green) probe evaluating the formation of singlet oxygen after treated with PpIX, P‐TH and OP‐TH followed by 650 nm laser for 10 min (100 mW cm−2). B) Ex vivo immunofluorescence images of HIF‐1α (red) in tumor of different groups. C) Ex vivo immunofluorescence images of hypoxia area (green) in tumor stained by Hypoxyprobe.
