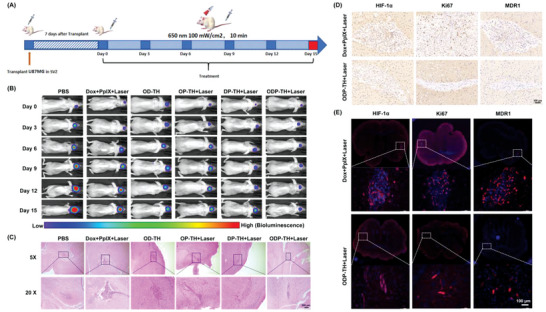
Figure 9.

Administration process of in orthotopic glioma mice (A). Bioluminescence imaging of mice heads in different treatment groups (B). Enhanced effectiveness evaluation of ODP‐TH on the orthotopic glioma model. C) HE stained brain slices, glioma tissues were circled by dotted line(10×). D) Immunohistochemistry images of glioma tissues. (30×). E) Immunofluorescence images of glioma tissues stained with HIF‐1α antibody (red), Ki‐67 antibody (red), and MDR‐1 antibody (red) (20×). Mean ± SD, n = 3.
