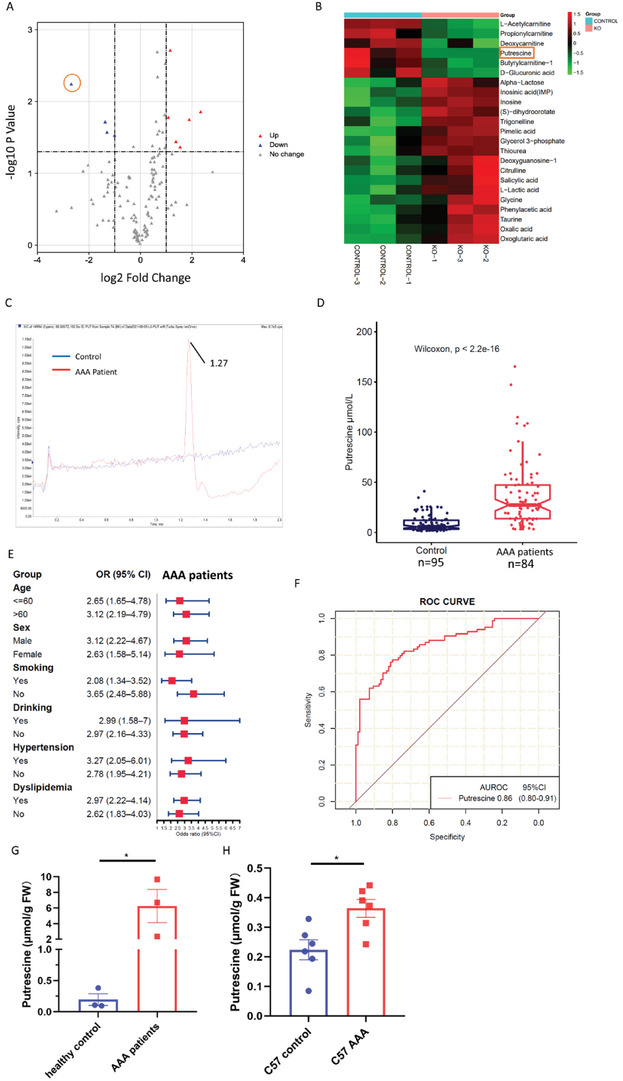
Figure 2.

Putrescine upregulated in AAA patients’ plasma. A,B) Volcano plot (A) and heatmap (B) illustrating differential metabolites between the aortas of GSDMDfl/flSM22Cre+/− and GSDMDfl/fl mice. The orange box shows the putrescine. n = 3. C) Representative extracted ion chromatogram for putrescine of healthy control and AAA patients. D) Putrescine concentrations of human plasma from 95 healthy controls and 84 AAA patients. Wilcoxon test. E) Forest plot showing the per‐SD OR (95% CI) for plasma putrescine concentrations associated with AAA in subgroups. Logistic regression. F) ROC curves: AAA versus healthy controls for putrescine. G) Putrescine concentrations of human normal aortas and aneurysmal aortas patients. n = 3 per group. FW, fresh weight. Student's t‐test, *p < 0.05. H) Putrescine of C57BL/6J mice aortas with 14 days postperfusion of elastase or saline. n = 6 per group. FW, fresh weight. Student's t‐test, *p < 0.05.
