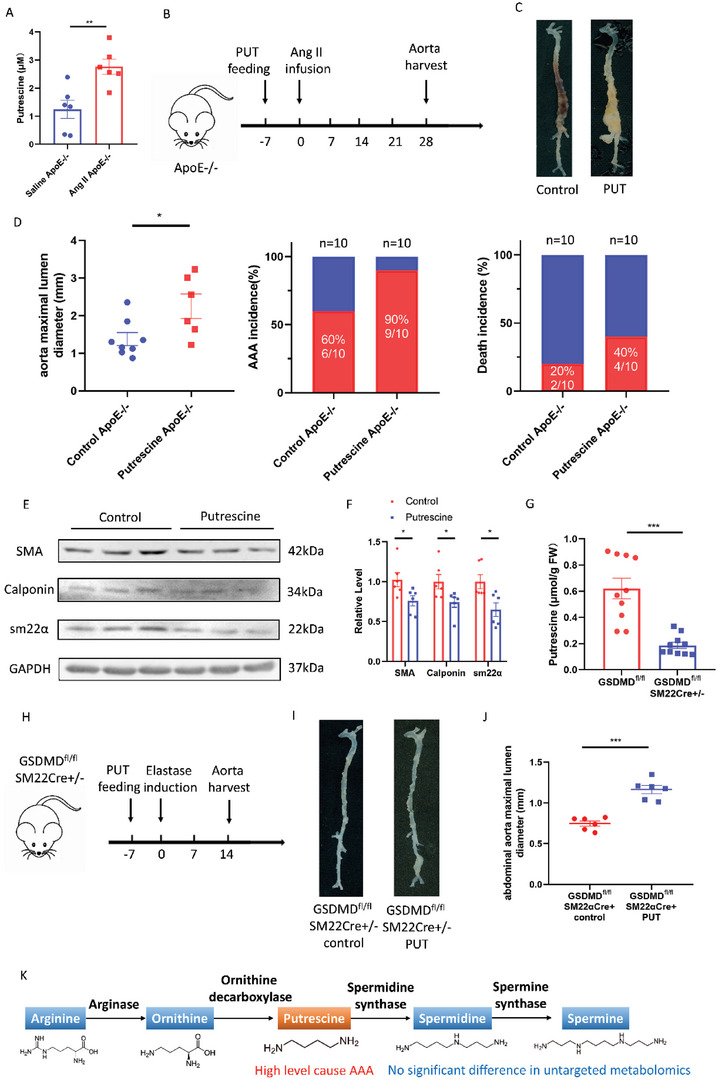
Figure 3.

A high level of putrescine caused AAA via VSMCs phenotype switching. A–D) Twenty‐eight‐day infusion of Ang II or saline in 3‐month‐old ApoE−/− male mice challenged with or without 1% putrescine in drinking water. Putrescine concentrations of ApoE−/− mice plasma challenged with Ang II or saline. n = 6 per group. Student's t‐test, **p < 0.01 (A). The timeline of putrescine feeding and Ang II infusion (B). Representative morphology of the aortas (C). The quantification of maximal suprarenal aortic diameters measured ex vivo, the incidence of AAA, and the death rate of mice. The red part in a histogram is the incidence and death rate of AAA model mice. The blue part in a histogram is the non‐disease and survival rate of AAA model mice (D). n = 8 for water‐administered and n = 6 for putrescine‐administered. Student's t‐test, *p < 0.05. E,F) Representative western blotting (E) and quantification (F) from aortas of C57BL/6J mice challenged with or without 1% putrescine in drinking water with 14 days postperfusion of elastase. Student's t‐test, *p < 0.05. G) Putrescine concentrations of aortas of GSDMDfl/flSM22Cre+/− and GSDMDfl/fl mice with 14 days postperfusion of elastase. FW, fresh weight. Student's t‐test, n = 10 per group, ***p < 0.001. H–J) Fourteen‐day postperfusion of elastase in 3‐month‐old GSDMDfl/flSM22Cre+/− male mice challenged with or without 1% putrescine in drinking water. n = 6 per group. The timeline of putrescine feeding and elastase induction (H). Representative morphology of the aortas (I). The quantification of maximal infrarenal aortic diameters measured ex vivo. Student's t‐test, ***p < 0.001 (J). K) Schematic diagram of the putrescine metabolic pathway.
