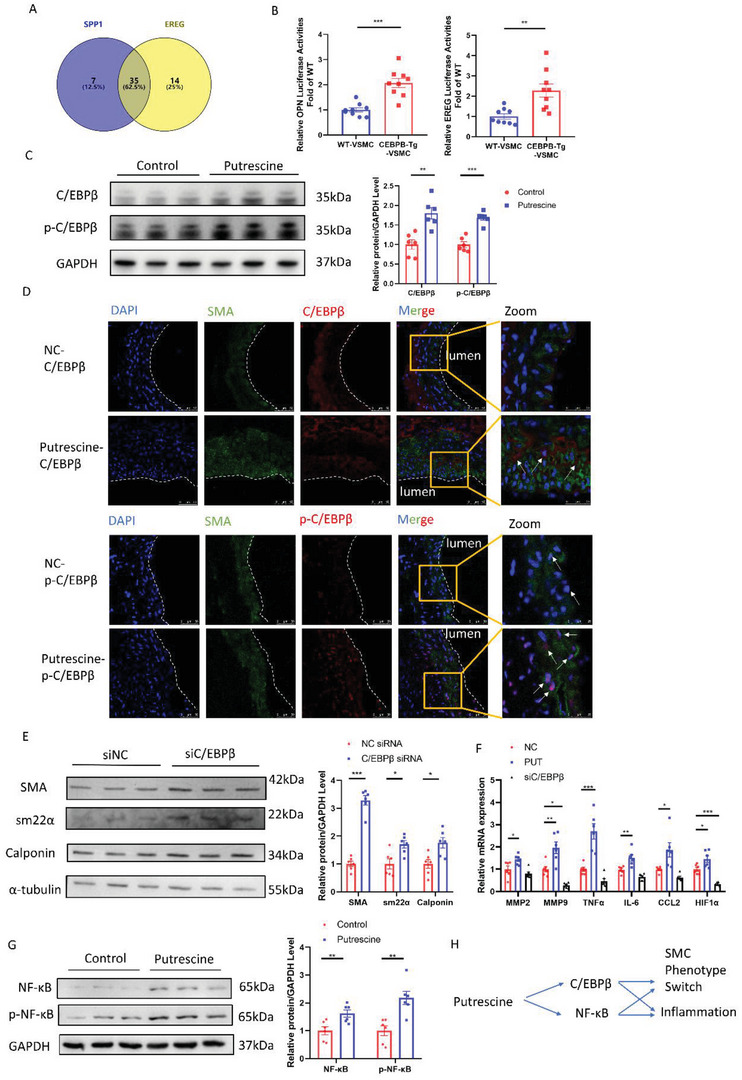
Figure 6.

Putrescine switched the phenotype of VSMCs and aggravated inflammation. A) Venn diagram illustrating the predictive transcription factors of several classical genes for a VSMCs contractile phenotype via PROMO. B) OPN and EREG activity in WT and CEBPB‐Tg 293T cells; OPN and EREG promoter activity was measured by a dual‐luciferase reporter system. n = 9 per group. Student's t‐test, **p < 0.01, ***p < 0.001. C) Representative western blotting and quantification of C/EBPβ and p‐C/EBPβ from HASMCs incubated with or without 50 µm putrescine for 24 h. n = 6 per group. Student's t‐test, *p < 0.05, ***p < 0.001. D) Representative immunofluorescence staining of C/EBPβ or p‐C/EBPβ (red) and SM22α (green) in 14‐day postperfusion of elastase in 3‐month‐old C57BL/6J male mice challenged with or without 1% putrescine in drinking water, scale bar = 50 µm. E) Representative western blotting and quantification from HASMCs stimulated with 50 µm putrescine for 24 h after transfecting with C/EBPβ siRNA or NC siRNA for 24 h. n = 6 per group. Student's t‐test, *p < 0.05, ***p < 0.001. F) mRNA abundance of inflammation factors in HASMCs incubated with 50 µm putrescine, C/EBPβ siRNA, or NC siRNA for 24 h. n = 6 per group. One‐way ANOVA and Dunn post hoc test, *p < 0.05, **p < 0.01, ***p < 0.001. G) Representative western blotting and quantification of NF‐κB and p‐NF‐κB from HASMCs incubated with or without 50 µm putrescine for 24 h. n = 6 per group. Student's t‐test, **p < 0.01. H) Schematic diagram of putrescine affection on HASMCs.
