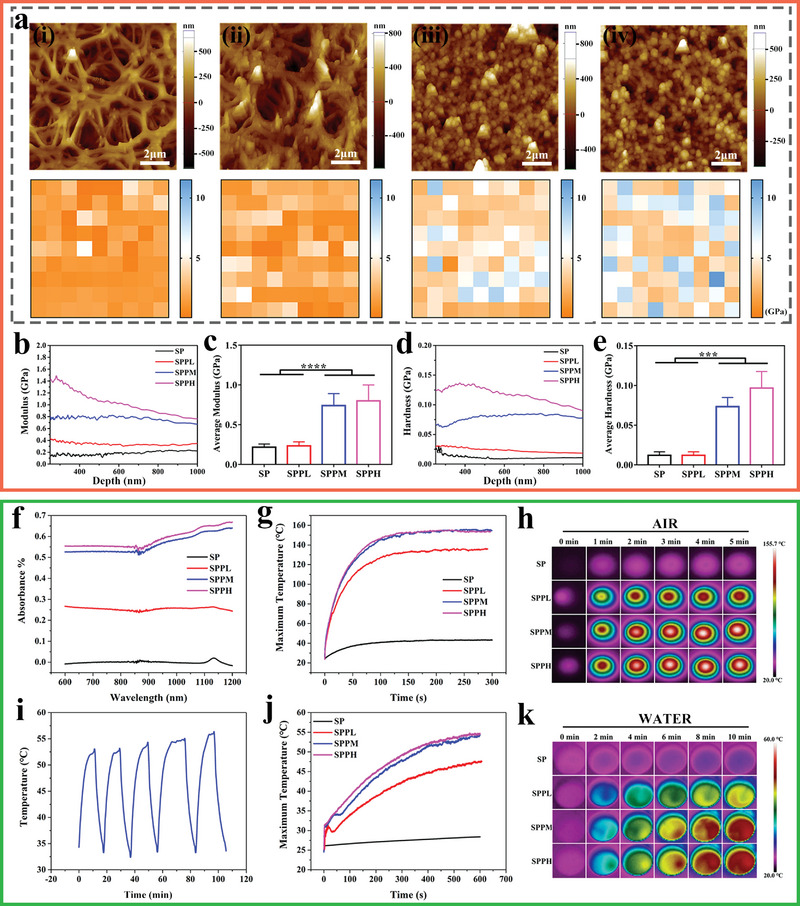
Figure 2.

Surface physicochemical properties of each group. a) Atomic force microscope images and corresponding heat maps of elastic modulus distribution on i) SP, ii) SPPL, iii) SPPM, and iv) SPPH. b) Elastic modulus curves and c) average modulus; d) Hardness curves and e) average hardness detected by nano‐indentation tests for different samples. f) UV–vis absorption spectrum. g) Temperature change and h) Infrared thermal images of different samples under 808 nm NIR at 0.5 W cm−2 in air. i) Temperature variations of SPPM samples for 5 on/off cycles in 1 mL ultrapure water. j) Temperature change and k) Infrared thermal images of different samples under 808 nm NIR at 0.5 W cm−2 in 1 mL ultrapure water. Data represent means ± SD (n = 6). Statistical significance was calculated by one‐way ANOVA analysis. *p < 0.05; **p < 0.01; ***p < 0.001; ****p < 0.0001.
