
Figure 5.
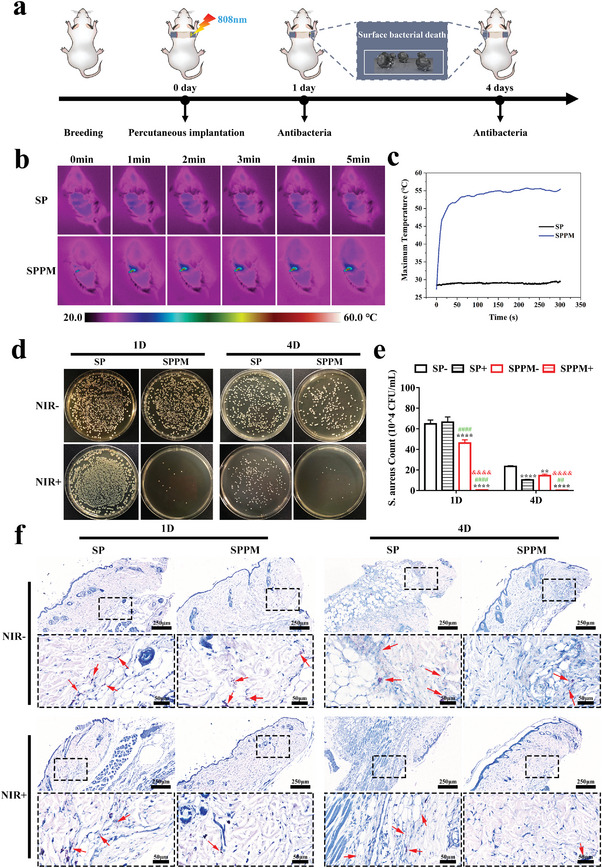
In vivo Antibacterial. a) Schematic diagram of photothermal antibacterial process of materials. b) Infrared thermal images and c) Temperature changes of implantation site in mice under NIR irradiation at a power density of 0.5 W cm−2. d) Bacterial colony plate images at ten times dilution and e) colony count statistics of S. aureus in each group after 1 and 4 days of implantation. f) Giemsa staining of surrounding tissues 1 and 4 days after implantation in different groups. Deep purple: bacterial colonies. Data represent means ± SD (n = 3). Statistical significance was calculated by two‐way ANOVA analysis and Tukey's multiple comparison tests. *p < 0.05; **p < 0.01; ***p < 0.001; ****p < 0.0001 compared with SP‐. & p < 0.05; && p < 0.01; &&& p < 0.001; &&&& p < 0.0001 compared with SPPM‐. # p < 0.05; ## p < 0.01; ### p < 0.001; #### p < 0.0001 compared with SP+.