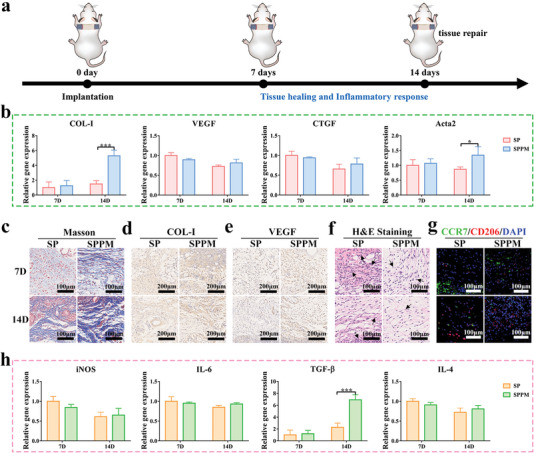
Figure 8.

Tissue healing in the percutaneous implantation model. a) Schematic diagram of model construction process. b) Tissue healing related gene expression levels after implantation for 7 and 14 days. c) Masson staining images; Immunohistochemical staining images of d) COL‐I and e) VEGF; f) H&E staining images; g) Immunofluorescence staining images of labeled macrophage phenotype (M1: CCR7: Green; M2: CD206: Red; DAPI: Blue) in surrounding tissues of SP and SPPM groups at 7 and 14 days. h) Expression levels of inflammation‐related genes at 7 and 14 days. Data represent means ± SD (n = 3). Statistical significance was calculated by two‐way ANOVA analysis and Tukey's multiple comparison tests. *p < 0.05; **p < 0.01; ***p < 0.001.
