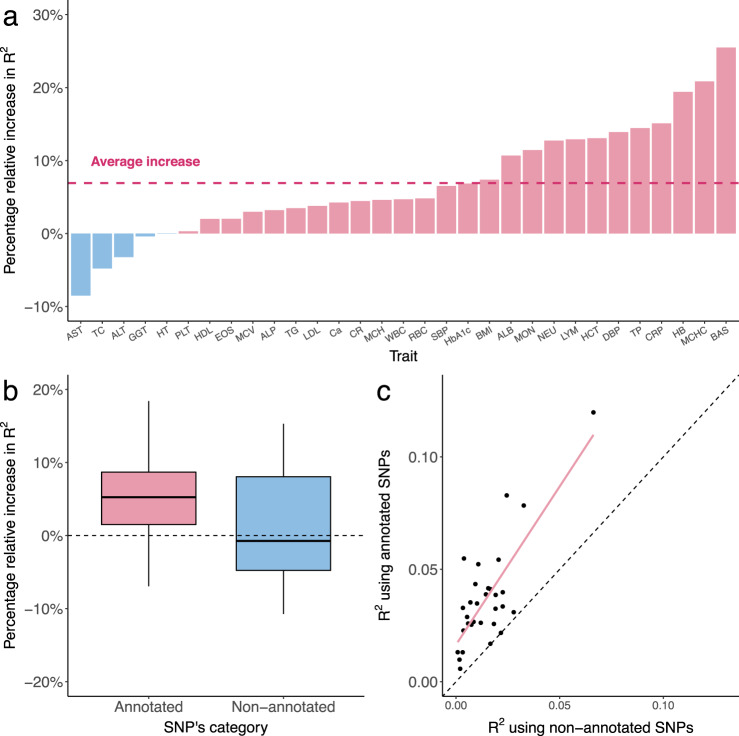
Fig. 4. Local genetic correlation annotation improves PRS prediction accuracy for 31 traits in East Asians.
a The percentage relative increase in R2 for prediction accuracy of annotation-informed European PRS over PRS-CSx European PRS. A list of trait acronyms can be found in Supplementary Data 7. b The percentage relative increase in R2 for prediction accuracy of annotation-informed over PRS-CSx European PRS using only annotated and non-annotated SNPs (n = 31 traits). In the boxplot, the center line, box limits and whiskers denote the median, upper and lower quartiles, and 1.5 × interquartile range, respectively. c Comparison of R2 between annotation-informed European PRS using only annotated and non-annotated SNPs. Each point represents a trait. X-axis is the R2 for PRS based on non-annotated SNPs. Y-axis is the R2 for PRS based on annotated SNPs.

