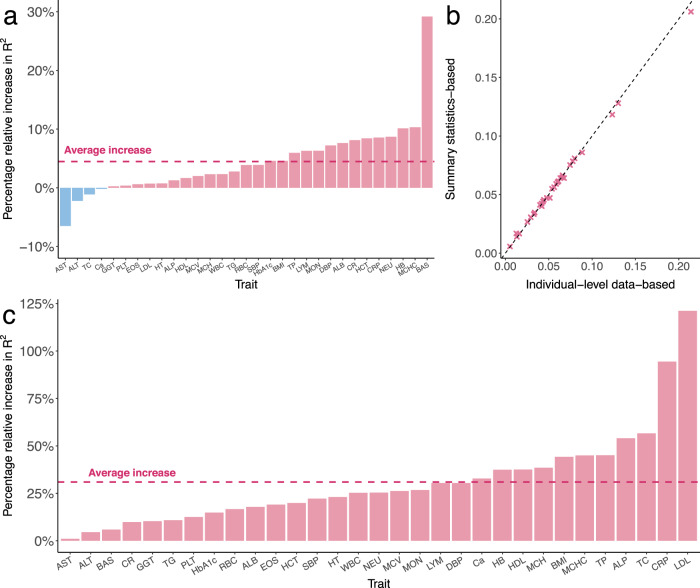
Fig. 5. Performance of X-Wing in combining population-specific PRS using GWAS summary statistics for 31 traits in East Asian samples.
a The percentage relative increase in R2 of X-Wing PRS over PRS-CSx. The dashed line represents the average increase. A list of trait acronyms can be found in Supplementary Data 5. b Comparison of R2 for linearly combined PRS with mixing weights obtained using GWAS summary statistics and individual-level data. The X-axis represents the R2 using weights estimated from individual-level data, while the Y-axis shows the R2 using summary statistics-based weights. The dashed line represents the diagonal line of y = x. c The percentage relative increase in R2 of X-Wing PRS over PRS-CSx using GWAS summary statistics. PRS-CSx PRS is calculated based on European posterior mean effects. The dashed line represents the average increase.

