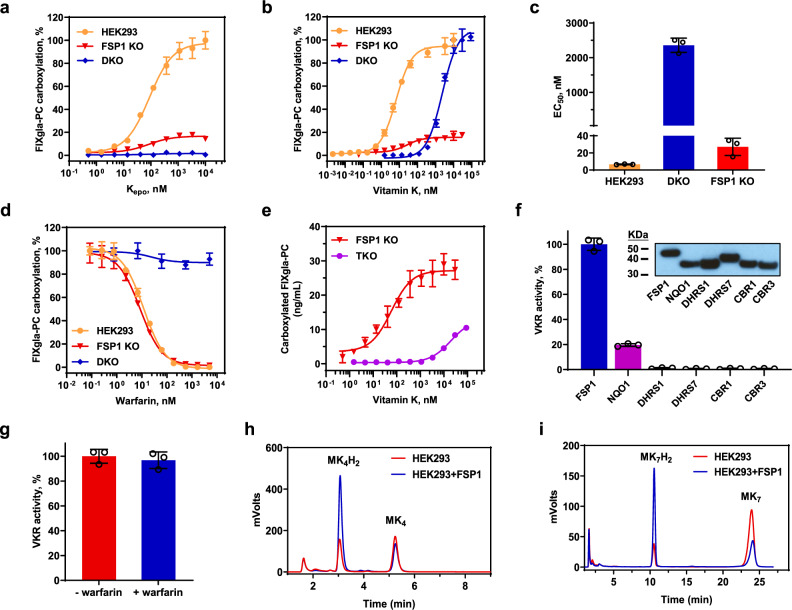
Fig. 3. Characterization of vitamin K reduction in different reporter cells.
a Kepo and b vitamin K concentration titrations in different reporter cells. Reporter cells were incubated with increasing concentrations of Kepo or vitamin K for 24 h. VKD carboxylation of the reporter-protein FIXgla-PC were determined using ELISA. Carboxylation activity of HEK293 cells at the highest Kepo or vitamin K concentration was normalized to 100%. HEK293: FIXgla-PC/HEK293 reporter cell; FSP1 KO: FIXgla-PC/HEK293 cells with their endogenous fsp1 gene knocked out; DKO: FIXgla-PC/HEK293 with their endogenous vkor and vkorl genes knocked out. c Half-maximal effective concentration of vitamin K (EC50) determined in HEK293, DKO, and FSP1 KO reporter cells from Fig. 3b. d Warfarin inhibition of VKD carboxylation in DKO and FSP1 KO cells with vitamin K as the substrate, and in FIXgla-PC/HEK293 cells with Kepo as the substrate. Increasing concentrations of warfarin with 11 µM vitamin K or 5 µM Kepo were incubated with the corresponding reporter cells for 24 h for VKD carboxylation activity assay. Carboxylation activity of each cell line without warfarin was normalized as 100%. e VKD carboxylation efficiency in FSP1 KO and TKO cells using vitamin K as the substrate. Carboxylation activity was presented as concentration of carboxylated reporter-protein in the cell culture medium (ng/mL) determined by ELISA. f HPLC-based conventional VKR in vitro activity assay of the selected NAD(P)H-dependent oxidoreductases in TKO cells. Candidate proteins were transiently expressed in TKO cells for 48 h and VKR activity of reducing vitamin K to KH2 was determined. VKR activity of FSP1 was normalized to 100%. Insert: Immunoblotting of the expression of the tested oxidoreductases and similar immunoblotting results were observed at least twice. DHRS, dehydrogenase/reductase SDR family protein; CBR, carbonyl reductase. (g) Warfarin inhibition of NQO1 reducing vitamin K to KH2 by HPLC-based VKR in vitro activity assay. Final concentration of warfarin in the reaction mixture was 100 μM. h, i reduction of menaquinone-4 (MK4) (h) and menaquinone-7 (MK7) (i) by FSP1 determined by monitoring the production of their corresponding hydroquinone by HPLC-based VKR in vitro activity assay. HEK293: cell lysate of HEK293 cells; HEK293 + FSP1, cell lysate of HEK293 cells overexpressing FSP1. A same number of HEK293 and HEK293 + FSP1 cells were used for the activity assay. Data are presented as mean ± SD of three independent experiments (n = 3) in Fig. 3a–g.

