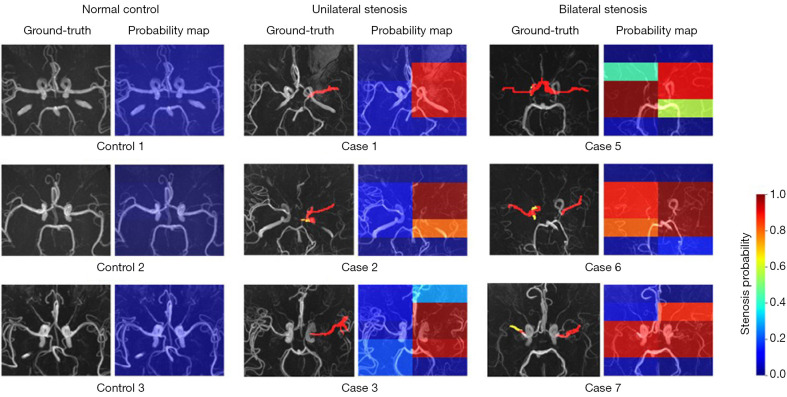
Figure 3.
Probability maps of three healthy controls, three patients with unilateral stenosis, and three patients with bilateral stenosis. The red and yellow masks in the ground truth respectively represent severe and mild stenosis/occlusion. The color in the probability maps corresponds to the stenosis probability value as shown by the color bar on the right.

