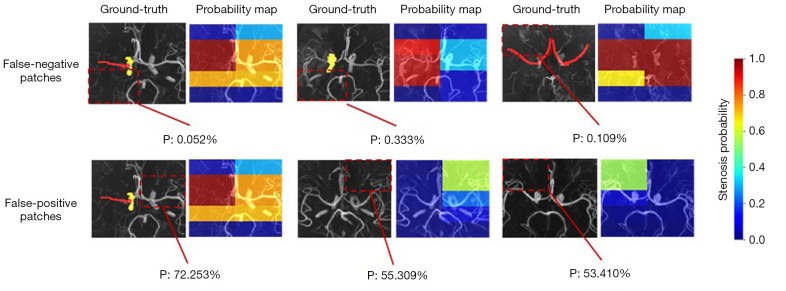
Figure 5.
False-negative and false-positive cases. The patches predicting a stenosis/occlusion are marked with a red dotted line, and the corresponding probabilities are shown at the bottom. The red and yellow masks in the ground-truth, respectively represent severe and mild stenosis/occlusion. Top: there were three cases with false-negative patches where the positive area was too small to be found. Bottom: there were three normal arteries with false-positive patches where small vessels or artifacts might have caused the false-positive results. P, probability.

