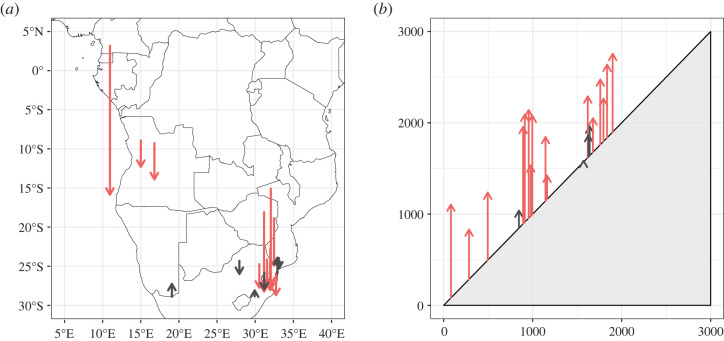
Figure 2.
Estimated shifts in Anopheles species’ observed latitudinal and elevational maxima over the twentieth century, where each arrow gives one species’ estimate (see electronic supplementary material, table S1). (a) Species’ estimated southern maxima, where starting points are given at the longitude of the southmost point in the first half of the century (1900–1950), and the arrow shows the estimated latitudinal shift from 1900 to 2000 (chosen as a standardized unit for visualization, rather than the entire observation period, given that some species are sampled over slightly different intervals). (b) Estimated elevational gain, 1900–2000 (y-axis), on a 1:1 elevational ‘gradient' (x-axis gives initial estimated elevational position). Red arrows indicate species for which temporal trends were statistically significant (p < 0.05).

