. 2023 Jan 3;83(4):641–651. doi: 10.1158/0008-5472.CAN-22-2146

Figure 1.

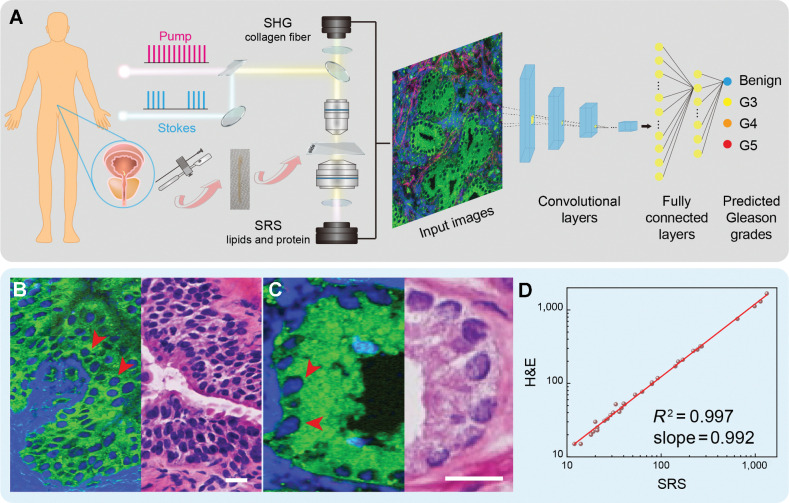
Figure 1. Experimental design and workflow. A, Illustration of prostate FT and taking fresh biopsy for SRS imaging and CNN-based Gleason grading and scoring. B, and C, SRS (left) and H&E (right) images of adjacent frozen sections from prostate tissues. D, Linear correlation plot of cell counting from SRS and H&E images (correlation factor R2 = 0.997). SRS images are color coded, green: lipid; blue: protein; red: collagen (SHG @ 405 nm). Scale bars, 25 μmol/L.

Experimental design and workflow. A, Illustration of prostate FT and taking fresh biopsy for SRS imaging and CNN-based Gleason grading and scoring. B and C, SRS (left) and H&E (right) images of adjacent frozen sections from prostate tissues. D, Linear correlation plot of cell counting from SRS and H&E images (correlation factor R2 = 0.997). SRS images are color coded. Green, lipid; blue, protein; red, collagen (SHG @ 405 nm). Scale bars, 25 μm.