. 2023 Jan 3;83(4):641–651. doi: 10.1158/0008-5472.CAN-22-2146

Figure 5.

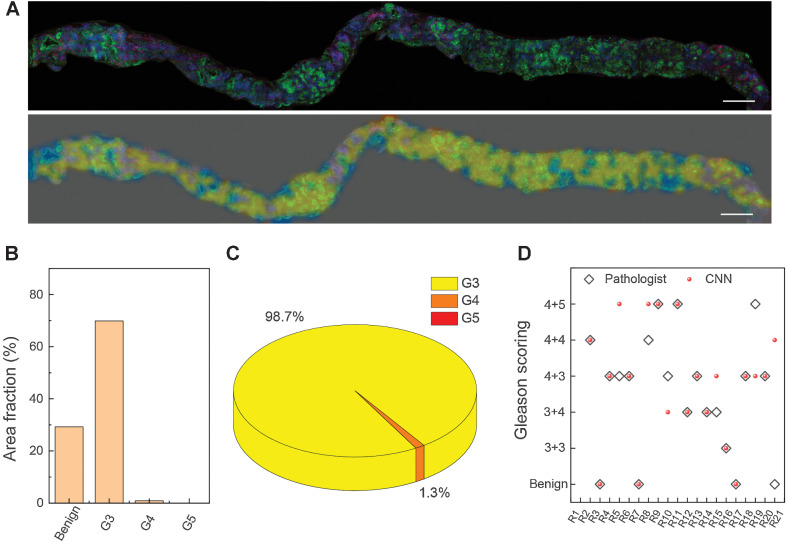
Figure 5. Color-coded and scoring fresh FT core needle biopsy. A, The presented SRS image of fresh FT core needle biopsy and the corresponding color-coded grading image. B, The quantification analysis of the area fraction of benign and G3–G5. C, The proportion of each Gleason pattern (G3–G5) in the whole tumor region. D, Diagnostic scoring results of CNN based SRS, compared with the consensus of three pathologists on 21 cases. Scale bars, 500 μmol/L.

Color-coded and scoring fresh FT core needle biopsy. A, The presented SRS image of fresh FT core needle biopsy and the corresponding color-coded grading image. B, The quantification analysis of the area fraction of benign and G3–G5. C, The proportion of each Gleason pattern (G3–G5) in the whole tumor region. D, Diagnostic scoring results of CNN-based SRS, compared with the consensus of three pathologists on 21 cases. Scale bars, 500 μm.