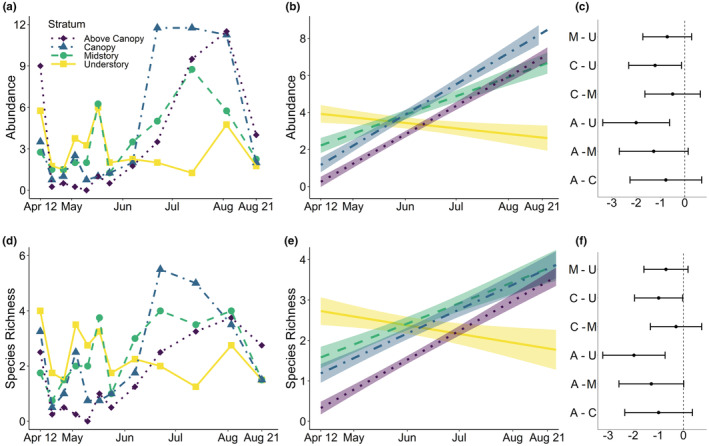
FIGURE 2.

Relationships between bee abundance (a–c) or species richness (d–f) and time of year among strata, including mean values of the data (a and d), fitted mixed effects models with 95% CI (b and e), and pairwise contrasts (logged response) between strata (c and f): Above canopy (A), Canopy (C), Midstory (M), and Understory (U).
