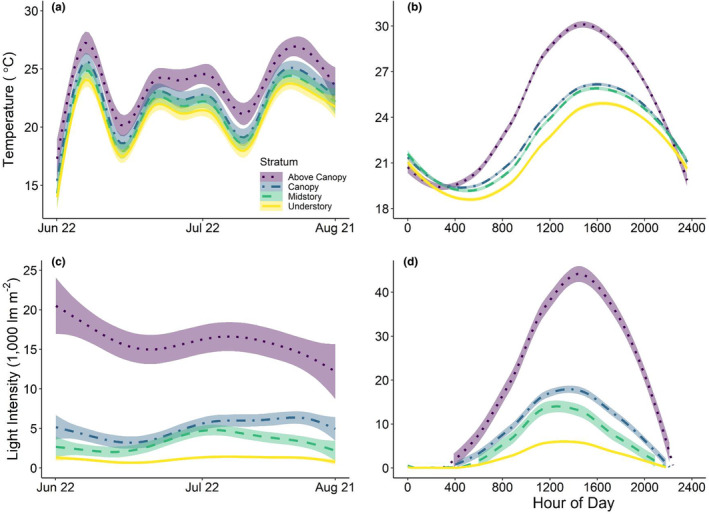
FIGURE A6.

Generalized additive regressions of mean temperatures (a, b) and light intensities (c, d) of traps at each stratum with 95% CI. Readings were recorded in 60‐min intervals from June 22 to August 21 (a, c). Records were taken at 10‐min intervals (b, d) from June 7 to 21 to represent a typical 24‐h (x‐axis) day.
