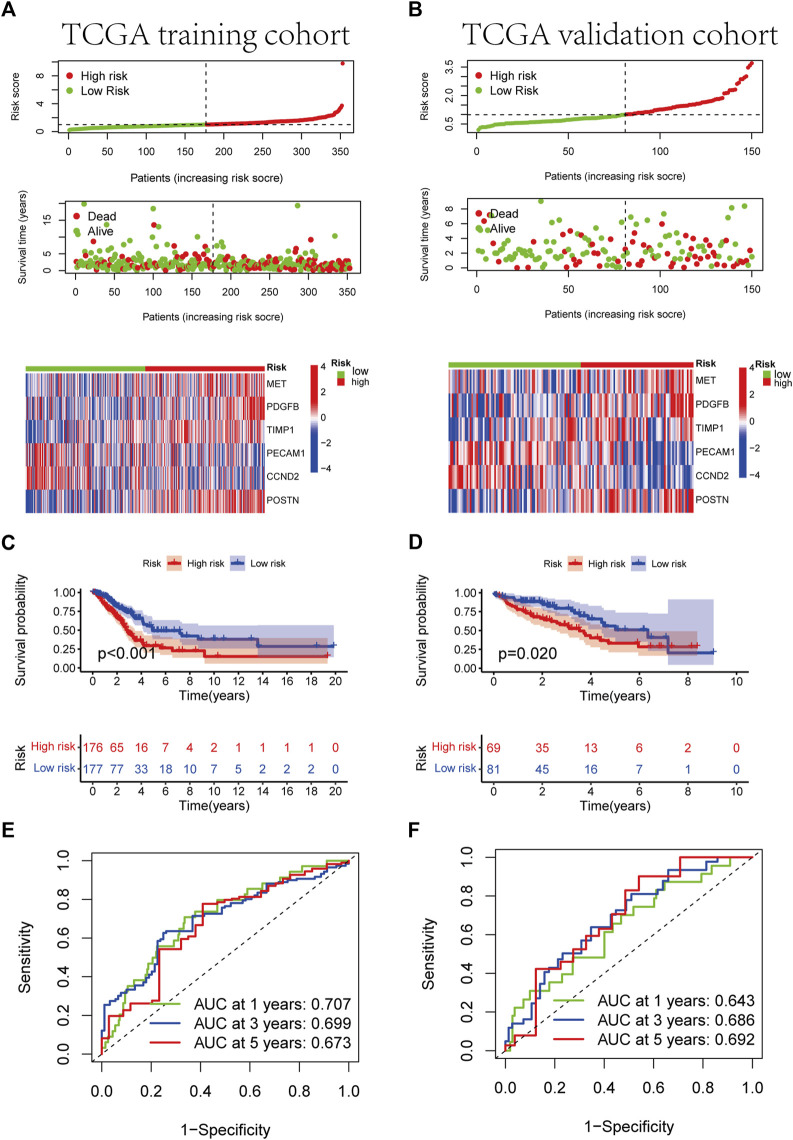
FIGURE 5.
Development of RS based on the 6 ARGs signature of patients with LUAD in the TCGA training and TCGA validation cohorts. (A, B) The heatmap of the 6 ARGs expression profiles between the high-risk and low-risk groups in the training or validation cohort, together with the RS distribution and patient vital status. (C, D) Kaplan-Meier analysis of the prognostic model in training or validation cohort. (E, F) The ideal AUC of the gene signature in the two cohorts was determined using a time-dependent ROC analysis.

