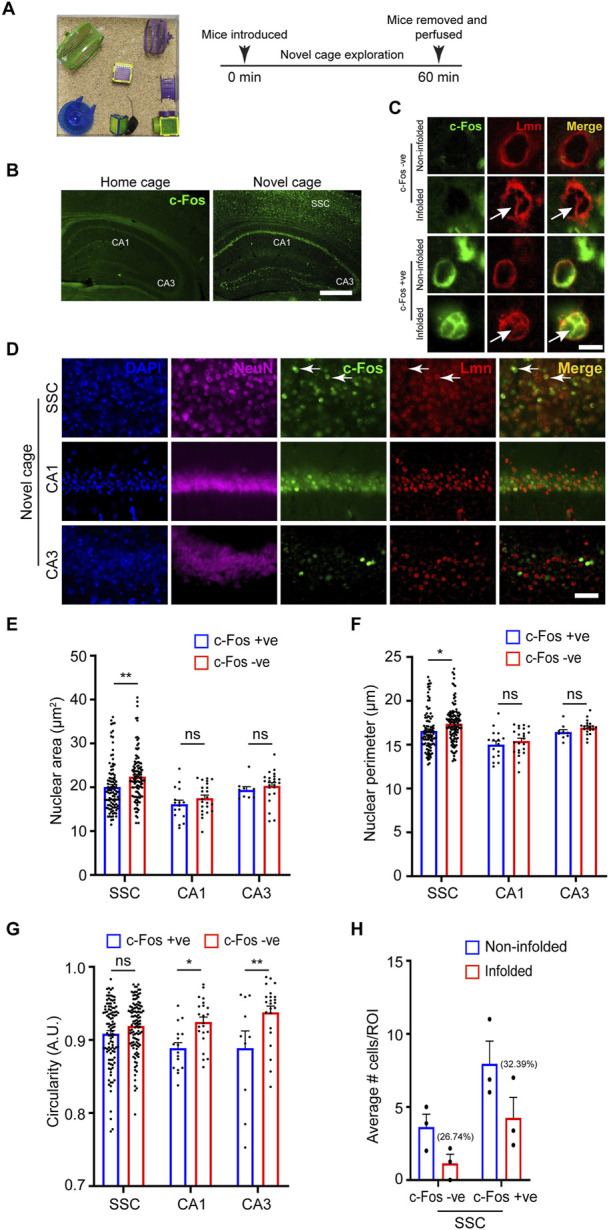
FIGURE 4.

Neuronal nuclear morphology following novel environment exploration. (A) Schematic representation of the novel environment and the experimental paradigm. (B) Immunostaining for the activity-induced immediate early gene c-Fos (green) shows robust upregulation of c-Fos in the neurons in the somatosensory cortex and hippocampal regions (white arrows) in novelty explored mice compared to home-caged control mice (Scale bar, 500 µm). (C) Immunostaining using anti-c-Fos (green) and anti-Lmn (red) shows the presence of nuclear infoldings in neurons of the somatosensory cortex (white arrows) (Scale bar, 5 µm). (D) Immunostaining using anti-NeuN (magenta), anti-cFos (green) and anti-Lmn (red) with DNA staining using DAPI (blue). Scale bar, 25 µm. White arrows indicate c-Fos-positive neurons. (E–G) Comparison of mean nuclear area (E), perimeter (F), and circularity (G) of c-Fos-negative and c-Fos-positive neurons in the somatosensory cortex and hippocampal CA1 and CA3 regions. (H) Comparison of average number of non-infolded vs. infolded nuclei in c-Fos-positive and c-Fos-negative cells. ROI is 0.01 mm2, n = 3 mice. Two-Way ANOVA (*p < 0.05, **p < 0.01, ***p < 0.001 and ****p < 0.0001). Data represented as mean ± SEM. S. cortex, somatosensory cortex.
