
Figure 2. Cryo‐EM structure of DDB1‐DCAF12‐CCT5.
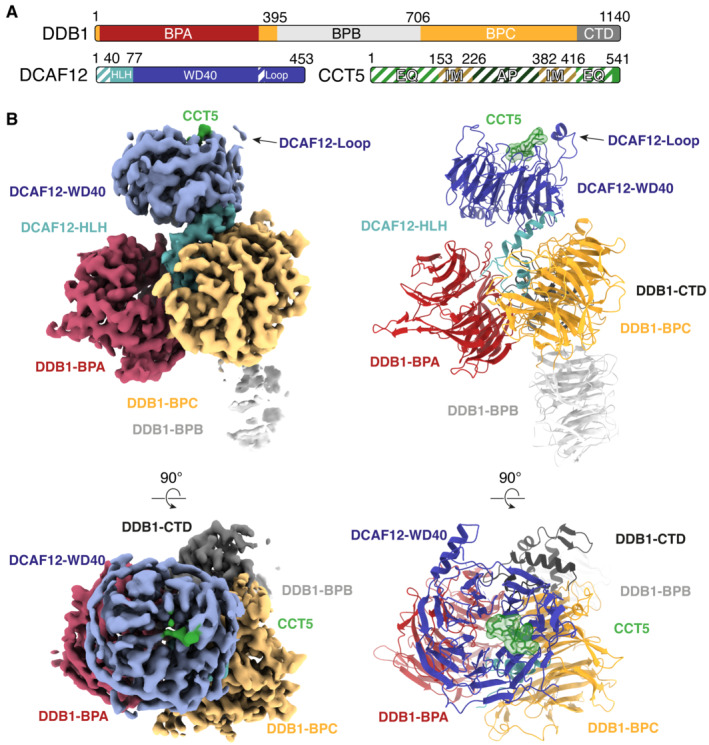
- Domain organization of the proteins present in the cryo‐EM sample. Unmodeled regions are shown as stripes.
- Different views of the DDB1‐DCAF12‐CCT5 cryo‐EM map (left) with fit structures (right). The map and models are colored as in (A). DDB1 and DCAF12 are shown as cartoons. The CCT5 peptide is shown as sticks with surface representation.