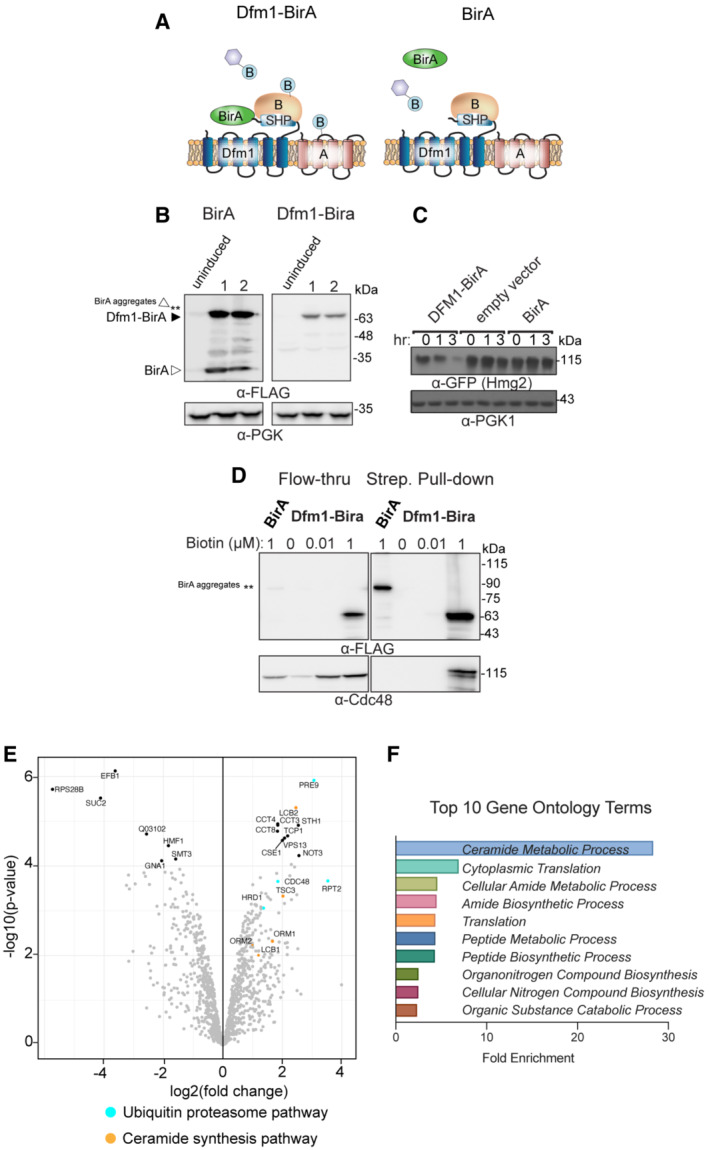
Schematic of Dfm1 fused with a biotin ligase, BirA, at the C‐terminus along with untagged Dfm1. Cartoon representation of the labeling of rhomboid pseudoprotease Dfm1 with the biotin ligase, BirA.
GALpr‐Dfm1‐BirA‐Flag and GALpr‐BirA‐Flag levels were measured by western blotting with α‐FLAG at 0 (uninduced) vs. 5 h post‐galactose induction (3 biological replicates; n = 3).
Dfm1‐BirA is still functional and able to degrade Hmg2‐GFP. dfm1Δ + Hmg2‐GFP strains containing DFM1‐BIRA, empty vector, or BIRA‐only add backs were grown to log phase and degradation was measured by CHX. After CHX addition, cells were lysed at the indicated times and analyzed by SDS–PAGE and immunoblotted for Hmg2‐GFP with α‐GFP.
Yeast strains expressing Dfm1‐Bira and BirA‐only negative control were incubated with different amounts of biotin: 0, 0.1, and 1 mM. dfm1Δ + Hmg2‐GFP. Microsomes were isolated from each strain and subjected to streptavidin pulldown (3 biological replicates; n = 3). Flow‐through and pull‐down fractions were detected by western blotting for Dfm1‐BirA with α‐Flag and Cdc48 with α‐Cdc48 antibodies.
A volcano plot showing enrichment versus the significance of proteins identified in Dfm1‐BirA experiments relative to control (BirA only) experiments. Components that were significantly enriched were ERAD components in blue (Hrd1, Cdc48, Pre9, and Rpt2) and sphingolipid biosynthesis in orange (Lcb2, Tsc3, and Orm1). Statistical analysis of interactome data was carried out using differential enrichment analysis of proteomics (DEP). Filter cut‐offs were set at log2FC ≥2, P‐value of ≤ 0.01, and at least two quantitative peptide features.
Top 10 gene ontology (GO) terms and their enrichment factor for the set of genes with the highest significance and fold enrichment.

