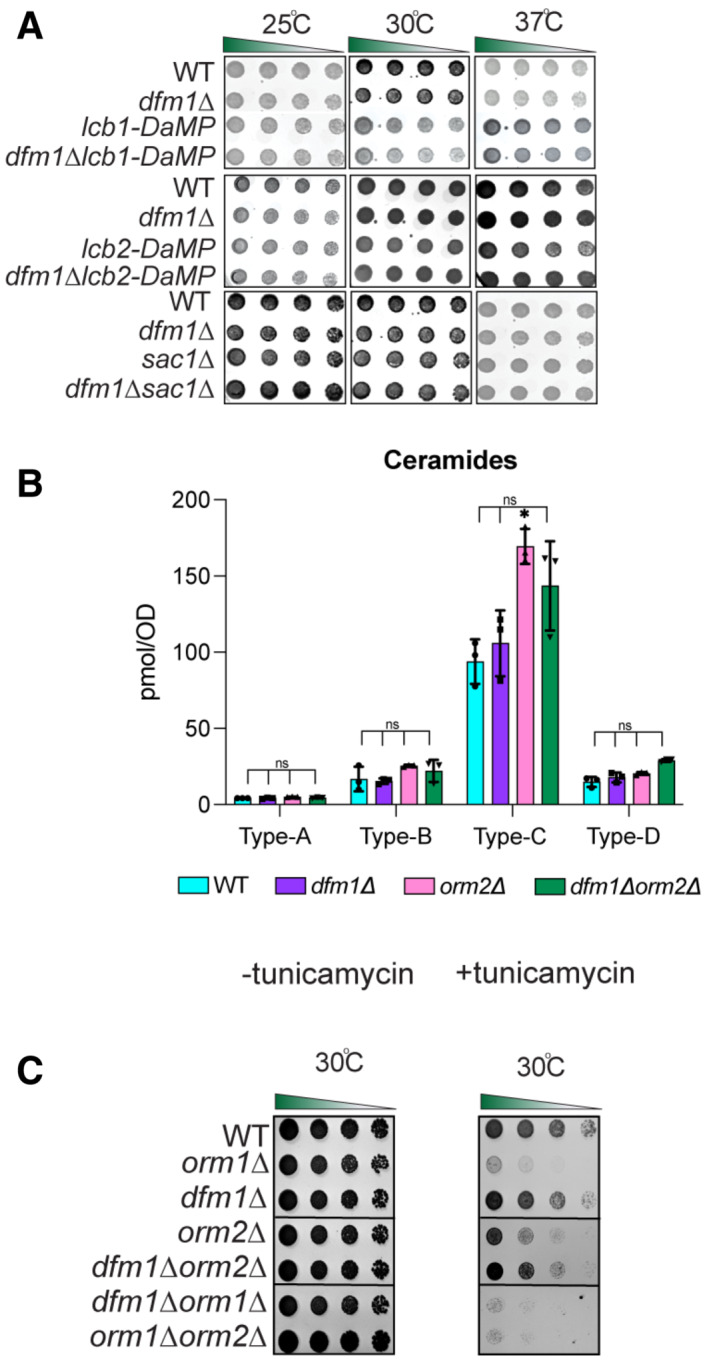
Indicated strains were spotted fivefold dilutions on SC plates in triplicates, and plates were incubated at room temperature, 30°C, and 37°C (3 biological replicates, 2 technical replicates; n = 3). Upper panel: WT, dfm1∆, Lcb1‐DaMP, and dfm1∆Lcb1‐DaMP were compared for growth by dilution assay. Middle panel: WT, dfm1∆, Lcb2‐DaMP, and dfm1∆Lcb2‐DaMP were compared for growth by dilution assay. Bottom panel: WT, dfm1∆, and dfm1∆ sac1∆ were compared for growth by dilution assay.
WT, dfm1∆, orm2∆, and orm2∆dfm1∆ cells were grown to log phase at 30°C and lipids were extracted and subjected to LC–MS/MS. A‐, B‐, C‐, and D‐type ceramides containing C16, C18, C20, C22, C24, and C26 fatty acids were measured (3 biological replicates; n = 3). Values represent the means ± S.E.M. Statistically significant differences compared to WT cells are indicated (pairwise Dunnett's test followed by Bonferroni's post hoc analysis; ns, non‐significant, *P < 0.05).
Serial dilution growth was performed on YPD plates in the presence or absence of 1 μg/ml tunicamycin using WT, orm1∆, orm2∆, dfm1∆, dfm1∆orm1∆, orm1∆orm2∆, and dfm1∆orm2∆ cells (3 biological replicates, 2 technical replicates; n = 3).

