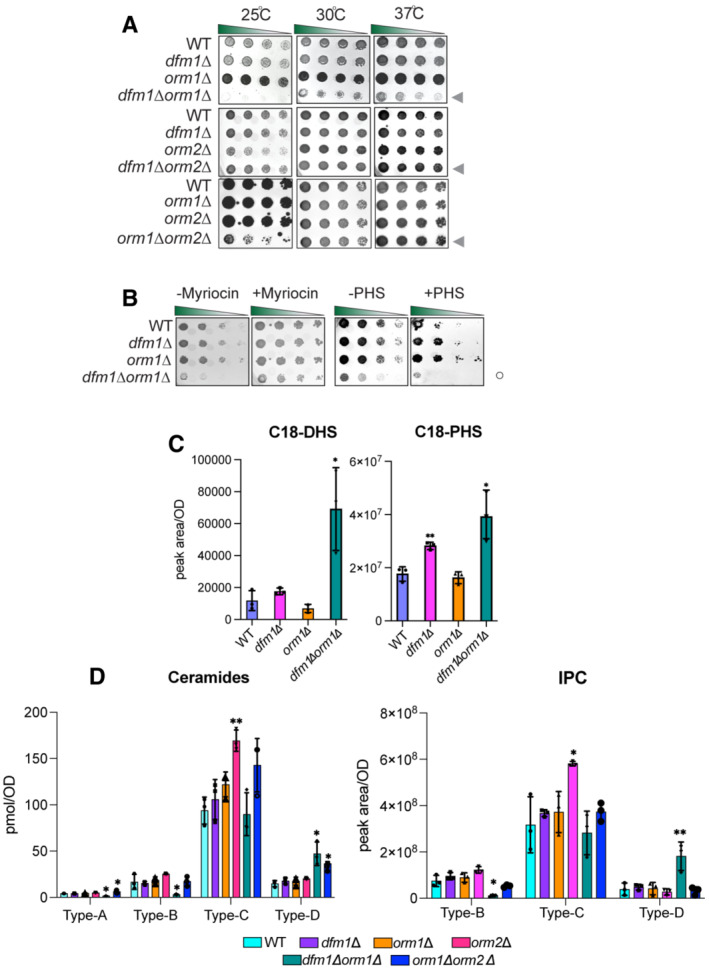
Indicated strains were spotted fivefold dilutions on SC plates in three biological replicates and two technical replicates (n = 5), and plates were incubated at room temperature, 30°C, and 37°C. Upper panel: WT, dfm1∆, orm1∆, and dfm1∆orm1∆ were compared for growth by dilution assay. Middle panel: WT, dfm1∆, orm2∆, and orm2∆tsc3∆ were compared for growth by dilution assay. Bottom panel: WT, dfm1∆, orm1∆, orm2∆, orm2∆, and orm1∆orm2∆ were compared for growth by dilution assay. Upper, middle, and lower panel: gray arrowhead depicts growth phenotype of dfm1∆orm1∆, dfm1∆orm2∆, and orm1∆orm2∆, respectively.
dfm1∆orm1∆ confers resistance to myriocin and sensitivity to PHS. WT, dfm1∆, orm1∆, and dfm1∆orm1∆ strains were grown to log phase in SC medium, and fivefold serial dilutions of cultures were spotted on YPD plates containing either drug vehicle alone, or 1 mM of myriocin and 10 μM of PHS with each condition performed in three biological replicates and two technical replicates (n = 5). Plates were incubated at room temperature and photographed after 3 days. Open circle indicates growth phenotype of dfm1∆orm1∆ cells.
WT, dfm1∆, orm1∆, and orm1∆dfm1∆ cells were grown to log‐phase at 30°C, and lipids were extracted and subjected to LC–MS/MS. C18 PHS and DHS levels were measured as described in Methods (3 biological replicates; n = 3). Values represent the means ± S.E.M. Statistically significant differences compared to WT cells are indicated (pairwise Dunnett's test followed by Bonferroni's post hoc analysis; *P < 0.05, **P < 0.01).
WT, dfm1∆, orm1∆, orm2∆, dfm1∆orm1∆, and orm1∆orm2∆ cells were grown to log‐phase at 30°C, and lipids were extracted and subjected to LC–MS/MS. A‐, B‐, C‐, and D‐type ceramides containing C16, C18, C20, C22, C24, and C26 fatty acid (left graph) and B‐, C‐, and D‐type IPCs containing C24 and C26 fatty acid (right graph) were measured (3 biological replicates; n = 3). Values represent the means ± S.E.M. Statistically significant differences compared to WT cells are indicated (pairwise Dunnett's test followed by Bonferroni's post hoc analysis; *P < 0.05, **P < 0.01).

