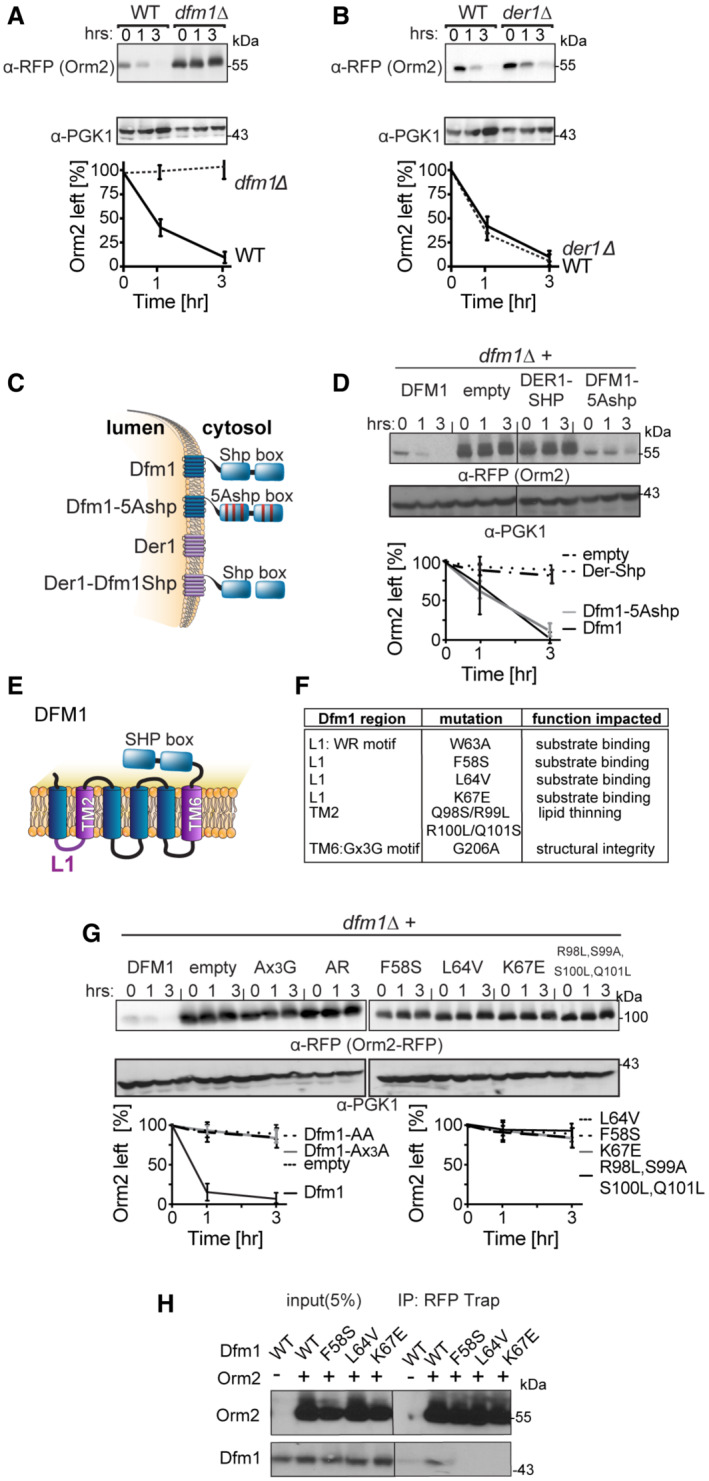
Figure 5. Dfm1 targets Orm2 for degradation.

- Degradation of Orm2 depends on Dfm1 and not Der1. The indicated strains expressing Orm2‐RFP were grown into the log phase and degradation was measured by cycloheximide chase (CHX). After CHX addition, cells were lysed at the indicated times, analyzed by SDS–PAGE, and immunoblotted for Orm2‐RFP with α‐RFP (3 biological replicates; n = 3).
- Same as (A) except degradation of Orm2‐RFP was measured in WT and der1∆ cells (3 biological replicates; n = 3).
- Depiction of Dfm1, Der1, Dfm1‐5Ashp, and Der1‐Shp. Dfm1 and Der1 are ER‐localized membrane proteins with six transmembrane domains (Greenblatt et al, 2011). Unlike Der1, Dfm1 has an extended cytoplasmic tail containing two SHP boxes.
- Dfm1's SHP box is not required for degradation of Orm2‐RFP. In the indicated strains, degradation of Orm2‐RFP was measured by CHX‐chase assay. Cells were analyzed by SDS–PAGE and immunoblotted for Orm2‐RFP with α‐RFP (3 biological replicates; n = 3).
- Depiction of Dfm1, which highlights L1, TM2, TM6, and its SHP box domain.
- Table indicating the location and specific function that is impaired for retrotranslocation‐deficient Dfm1 mutants (Nejatfard et al, 2021).
- Dfm1's WR motif, GxxxG motif, substrate‐binding, and lipid‐thinning function are required for the degradation of Orm2‐RFP. In the indicated strains, degradation of Orm2‐RFP was measured by CHX‐chase assay. Cells were analyzed by SDS–PAGE and immunoblotted for Orm2‐RFP with α‐RFP (3 biological replicates; n = 3).
- Dfm1 L1 residues are required for binding to Orm2. Orm2‐RFP and binding to retrotranslocation‐deficient Dfm1 L1 mutants were analyzed by co‐IP. The IP was analyzed for the presence of Dfm1‐HA. As a negative control, cells not expressing Orm2‐RFP were used (3 biological replicates; n = 3). Band intensities for all western blots were normalized to PGK1 loading control and quantified by ImageJ.
Data information: t = 0 was taken as 100% and data are represented as mean ± SEM.
