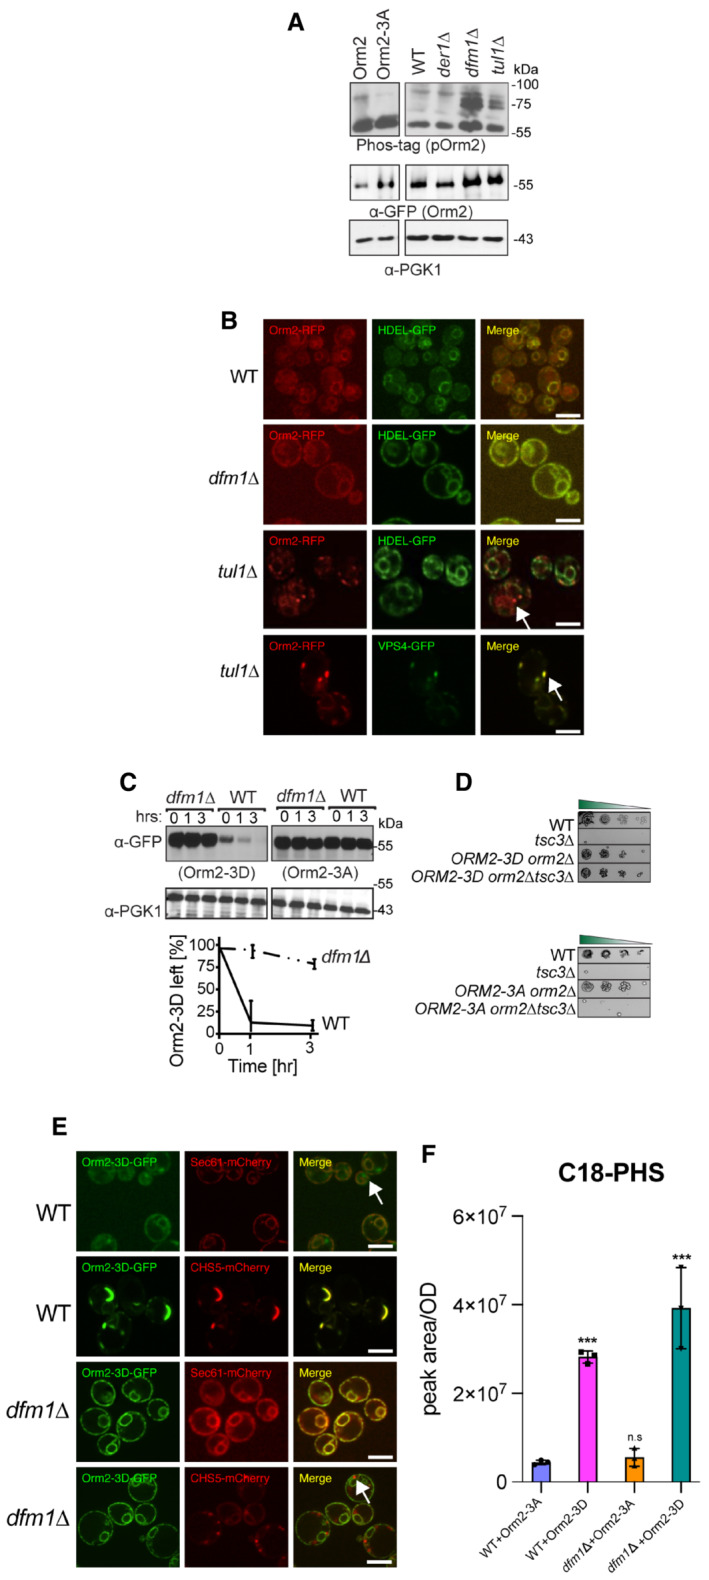
Phosphorylated Orm2 accumulates in the absence of Dfm1. Phos‐tag western blot analysis shows that there is an accumulation of phosphorylated Orm2 in dfm1∆ cells. The indicated strains were grown to log phase, treated with vehicle or 1.5 μM myriocin for 1 h, and subjected to SDS–PAGE or Phos‐tag western blot analysis via blotting for Orm2 with α‐RFP and PGK1 with α‐PGK1 antibodies (2 biological replicates; n = 2).
Orm2 is retained in the ER in dfm1∆ cells. Strains were grown to mid‐exponential phase in minimal media and GFP and RFP fluorescence was examined on an AxioImager.M2 fluorescence microscope using a 100x objective and 28HE‐GFP or 20HE‐rhodamine filter sets (Zeiss; 2 biological replicates n = 2). WT, dfm1∆, and tul1∆ cells expressing Orm2‐RFP. HDEL‐GFP (ER marker, green) or VPS4‐GFP (endosome marker, green) was used to test for co‐localization with Orm2‐RFP. Arrowheads indicate Orm2 co‐localizing in post‐ER compartments. Scale bar, 5 μm.
dfm1∆ cells block the degradation of phosphorylated mimics of Orm2 (Orm2‐3D). In the indicated strains, degradation of Orm2‐3A‐GFP and Orm2‐3D‐GFP was measured by CHX‐chase assay. Cells were analyzed by SDS–PAGE and immunoblotted α‐GFP (3 biological replicates; n = 3). t = 0 was taken as 100% and data are represented as mean ± SEM.
Accumulation of phosphorylated Orm2 within the ER is sufficient for rescuing the temperature‐sensitive lethality of tsc3∆ cells. Indicated strains were spotted fivefold dilutions on SC plates and plates were incubated at 37°C (3 biological replicates, 2 technical replicates; n = 5).
dfm1∆ blocks the export of phosphorylated Orm2. Fluorescence imaging was performed as in (B) except WT and dfm1∆ cells expressing Orm2‐3D‐GFP were used (2 biological replicates; n = 2). Sec61‐mCherry (ER marker, red) or CHS5‐mCherry (endosome marker, red) was used to test for co‐localization with Orm2‐3D‐GFP. Arrowheads indicate Orm2 co‐localizing in post‐ER compartments. Scale bar, 5 μm.
WT and dfm1∆ cells expressing either Orm2‐3A‐GFP or Orm2‐3D‐GFP were grown to log phase at 30°C and lipids were extracted and subjected to LC–MS/MS. C18 PHS and DHS levels were measured as described in Methods in 3 biological replicates (n = 3). Values represent the means ± S.E.M. Statistically significant differences compared to WT cells are indicated (pairwise Dunnett's test followed by Bonferroni's post hoc analysis; ***P < 0.0001).

