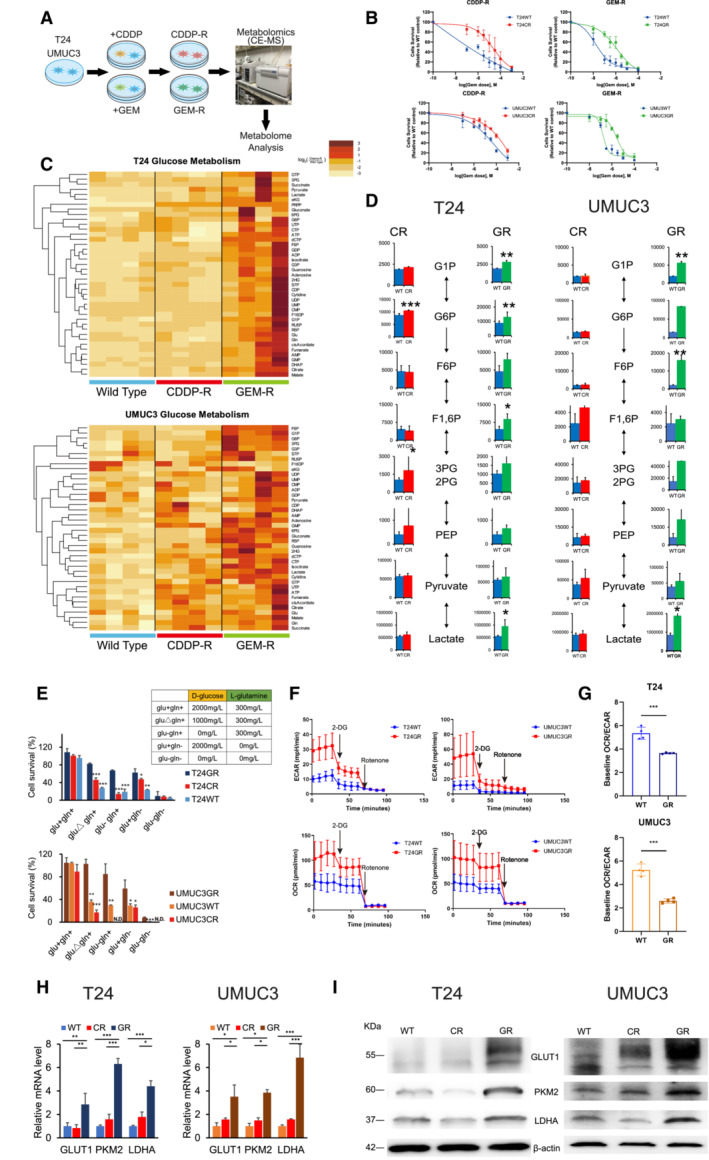
Figure 1. Metabolic differences among WT, CR, and GR UC cells.

- T24 and UMUC3 cisplatin‐resistant (CR) and gemcitabine‐resistant (GR) urothelial cancer (UC) cells were generated by exposing the corresponding wild‐type (WT) cells to up to 3 μM cisplatin (CDDP) or gemcitabine (GEM) over 12 or 18 months, respectively. Brief schema showing the generation of CR and GR cell lines. Metabolites, including CR and GR, were analyzed by using CE‐MS metabolomics.
- Graphs show changes in cytotoxicity between WT and GR T24 and UMUC3 cells exposed to increasing concentrations of GEM, and WST assays were performed 48 h after treatment (n = 3, biological replicates). The data are shown as the mean values ± SDs.
- Hierarchical clustering of significantly regulated metabolites among T24 and UMUC3 cells, including WT, CR, and GR cells (n = 4, biological replicates).
- Major metabolites altered in the glycolytic pathway in CR cells and GR cells compared with WT cells. The data are shown as the mean values ± SDs (n = 4) and were analyzed by Student's t‐test. *P < 0.05, **P < 0.01.
- Bar graph showing the survival of WT, CR, and GR cells in glucose‐ and glutamine‐replete (glu+, gln+), glutamine limitation (gluΔ, gln+), glucose deprivation (glu−, gln−), glutamine deprivation (glu+, gln−), or glucose and glutamine deprivation (glu−, gln−) medium. The table shows the glucose and glutamine concentrations in each medium. Significant differences were observed in GR cells compared with WT and/or CR cells after 48 h. The data are shown as the mean values ± SDs (n = 3, biological replicates) and were analyzed by Student's t‐test. *P < 0.05, **P < 0.01, ***P < 0.001. N.D., non‐detectable.
- WT and GR cells were seeded in 24‐well plates and exposed to 2‐DG and rotenone to measure baseline ECAR and baseline OCR. The data are shown as the mean values ± SDs (n = 3, biological replicates).
- Baseline OCR/ECAR ratios in WT and GR cells (upper: T24, lower: UMUC3). The data are shown as the mean values ± SDs (n = 3, biological replicates) and were analyzed by Student's t‐test. ***P < 0.001.
- Relative mRNA levels of GLUT1, PKM2, and LDHA, which are enzymes that regulate glycolysis. The data are shown as the mean values ± SEs (n = 3, biological replicates) and were analyzed by Student's t‐test, and the values are plotted relative to the expression levels in WT cells. *P < 0.05, **P < 0.01, ***P < 0.001.
- Western blot analysis of GLUT1, PKM2, LDHA, and β‐actin compared among WT, CR, and GR cells.
Source data are available online for this figure.
