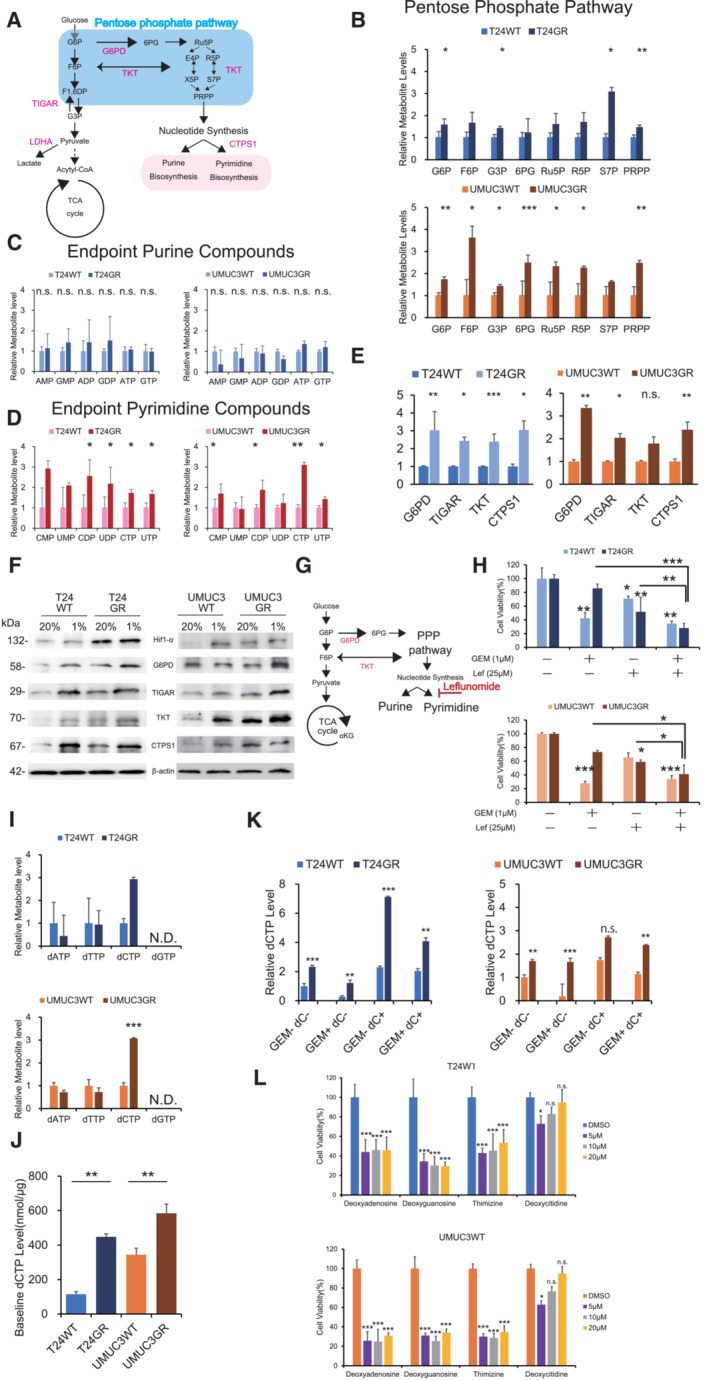
Figure 2. GR cells increases pyrimidine biosynthesis to generate dCTP.

- Schematic of altered mechanisms in GR cells in glycolysis and the pentose phosphate pathway (PPP). Glucose is transferred from aerobic glycolysis to PPP. Glucose flux into the PPP results in increased nucleotide biosynthesis, including purine and pyrimidine biosynthesis.
- PPP metabolite levels in T24GR and UMUC3GR cells relative to WT cells based on targeted CE‐MS metabolomics The data are shown as the mean values ± SDs (n = 3, biological replicates) and were analyzed by Student's t‐test. *P < 0.05, **P < 0.01, ***P < 0.001.
- Levels of endpoint metabolites of the purine synthesis pathway in GR cells relative to those in WT cells as determined by CE‐MS metabolomics. The data are shown as the mean values ± SDs (n = 3, biological replicates) and were analyzed by Student's t‐test. n.s., non‐significant
- Levels of endpoint metabolites of the pyrimidine synthesis pathway in GR cells relative to those in WT cells as determined by CE‐MS metabolomics. The data are shown as the mean values ± SDs (n = 3, biological replicates) and were analyzed by Student's t‐test. *P < 0.05, **P < 0.01.
- Relative mRNA expression levels of G6PD, TIGAR, TKT, and CTPS1, which are the genes responsible for activating the PPP and pyrimidine biosynthesis. WT and GR cells are shown. The data are shown as the mean values ± SEs (n = 3, biological replicates). The expression levels were analyzed by Student's t‐test and plotted relative to expression levels in WT cells (left: T24 cells, right: UMUC3 cells). *P < 0.05, **P < 0.01, ***P < 0.001, n.s., non‐significant.
- Western blot analysis of Hif‐1α, G6PD, TIGAR, TKT, CTPS1, and β‐actin in WT and GR cells under normoxia and hypoxia (left: T24 cells, right: UMUC3 cells).
- Simple schematic of the glycolytic pathway and the PPP. Glucose flux into the PPP results in increased nucleotide biosynthesis, including purine and pyrimidine biosynthesis. Leflunomide inhibits pyrimidine biosynthesis.
- The viability of WT and GR cells was assessed by WST assays under treatment with gemcitabine (Gem), leflunomide, or Gem with leflunomide. The data are shown as the mean values ± SDs (n = 3, biological replicates). Comparisons were made with respect to the corresponding controls or the indicated groups, followed by analysis with Student's t‐test. *P < 0.05, **P < 0.01, ***P < 0.001.
- CE‐MS‐based metabolite detection for diphosphate nucleosides in WT and GR cells. The data are shown as the mean values ± SDs (n = 3, biological replicates). The levels in GR cells are presented relative to those in WT control cells and analyzed by Student's t‐test. ***P < 0.001. N.D., non‐detectable.
- Comparison of baseline dCTP levels in WT and GR cell lines determined by CE‐MS metabolomic analysis. The data are shown as the mean values ± SDs (n = 3, biological replicates) and were analyzed by Student's t‐test. **P < 0.01.
- dCTP levels as determined by CE‐MS metabolomic analysis under treatment with 1 μM GEM and/or 10 μM deoxycytidine (dC) (left: T24 cells; right: UMUC3 cells). The data are shown as the mean values ± SDs (n = 3, biological replicates) and were analyzed by one‐way ANOVA with the Bonferroni test. **P ≤ 0.01, ***P ≤ 0.001. n.s., nonsignificant.
- Effect of deoxycytidine and other nucleosides (deoxyadenosine, deoxyguanosine, and thymidine) at various concentrations with 1 μM GEM in WT cells, as evaluated by WST assays 48 h post‐treatment (upper: T24 cells; lower: UMUC3 cells). The data are shown as the mean values ± SDs (n = 3, biological replicates) and were analyzed by one‐way ANOVA with the Bonferroni test. *P ≤ 0.05, ***P ≤ 0.001. n.s., non‐significant.
Source data are available online for this figure.
