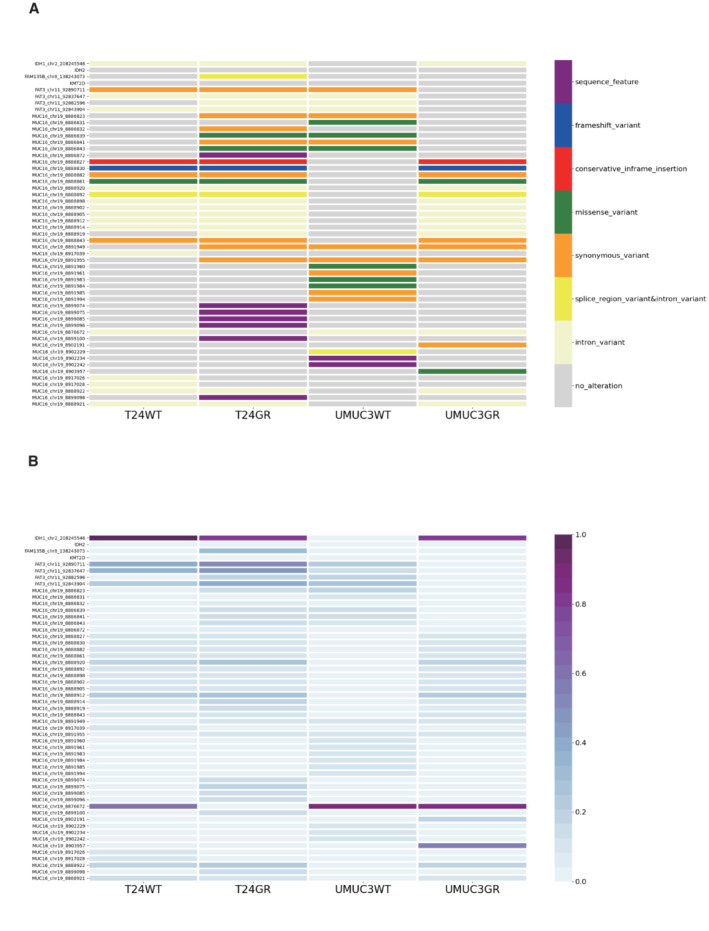
Figure EV2. Whole‐exome sequencing analysis of DNA in UC cell lines.

- Details of the whole‐exome sequencing analysis of DNA in T24WT, T24GR, UMUC3WT, and UMUC3GR cells. The vertical axis shows the genes and their genomic positions. The horizontal axis shows the tumor samples (T24WT, T24GR, UMUC3WT, and UMUC3GR).
- Details of the alteration rates of genomic positions in each gene. The alteration rates were calculated by the following equation: alteration depth/(alteration depth + reference depth).
