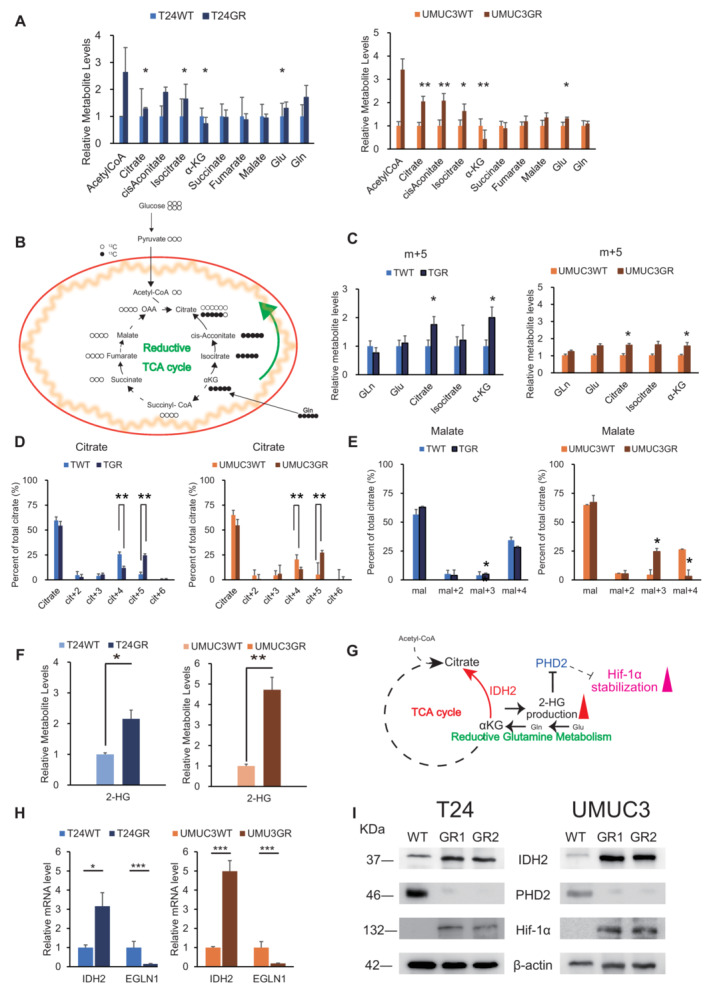
Figure 3. Reductive carboxylation produces 2‐HG to stabilize Hif‐1α.

- Levels of intermediate metabolites of the tricarboxylic acid cycle (TCA) cycle in GR cells relative to those in WT cells based on targeted CE‐MS metabolomics. The data are shown as the mean values ± SDs (n = 3, biological replicates) and were analyzed by Student's t‐test. *P < 0.05, **P < 0.01.
- Schematic describing the details of the reductive TCA cycle. Model depicting the pathways for citrate+4 (cit+4) and cit+5 production from [13C5‐] glutamine (glutamine+5). Glutamine+5 is catabolized to α‐ketogutarate+5, which can then contribute to citrate production by two divergent pathways. Normal metabolism in WT cells produces succinate+4, fumarate+4, malate+4, and oxaloacetate+4, which can condense with unlabeled acetyl‐CoA to produce citrate+4. In GR cells, altered mechanisms in the TCA cycle were observed in terms of high glutamate metabolism. The [13C5]‐labeled glutamate‐derived metabolite levels are indicated in black.
- The relative levels of metabolites contributing to citrate production through increased reductive carboxylation [glutamine (gln), glutamate (glu), α‐KG, and citrate] in T24GR cells versus WT cells. Cells were cultured for 24 h in 10 mM glutamine and then cultured for 1 h in medium supplemented with [13C5‐] glutamine. 13C enrichment in cellular citrate was quantitated by CE‐MS. The data are shown as the mean values ± SDs (n = 3, biological replicates) and were analyzed by Student's t‐test. *P < 0.05.
- 13C enrichment in cellular citrate determined by CE‐MS and normalized to the total pool size for the relevant metabolite (left: T24GR, right: UMUC3GR) The data are shown as the mean values ± SDs (n = 3, biological replicates) and were analyzed by Student's t‐test. **P < 0.01.
- 13C enrichment in cellular malate determined by CE‐MS and normalized to the total pool size for the relevant metabolite (left: T24GR, right: UMUC3GR) The data are shown as the mean values ± SDs (n = 3, biological replicates) and were analyzed by Student's t‐test. *P < 0.05.
- Relative 2‐hydroxyglutarate (2‐HG) production level based on targeted CE‐MS metabolomics comparing among WT and GR cells (left panel: T24, right panel: UMUC3). The data are shown as the mean values ± SDs (n = 3, biological replicates) and were analyzed by Student's t‐test. *P < 0.05, **P < 0.01.
- Schematic describing the wild type (WT) IDH2 gain of function which mediated the reductive glutamine metabolism. 2‐HG accumulation driven by WT‐IDH2 suppresses EGLN1/PHD2 expressions to stabilize Hif‐1α expression.
- Relative mRNA expression levels of IDH2 and EGLN1 genes compared between WT and GR cells (left panel: T24, right panel: UMUC3). The expression levels were analyzed by Student's t‐test and plotted relative to expression levels in WT cells. The data are shown as the mean values ± SEs (n = 3, biological replicates). *P < 0.05, ***P < 0.001.
- Western blot analysis of IDH2, PHD2, and β‐actin in WT and GR cells (left panel: T24, right panel: UMUC3).
Source data are available online for this figure.
