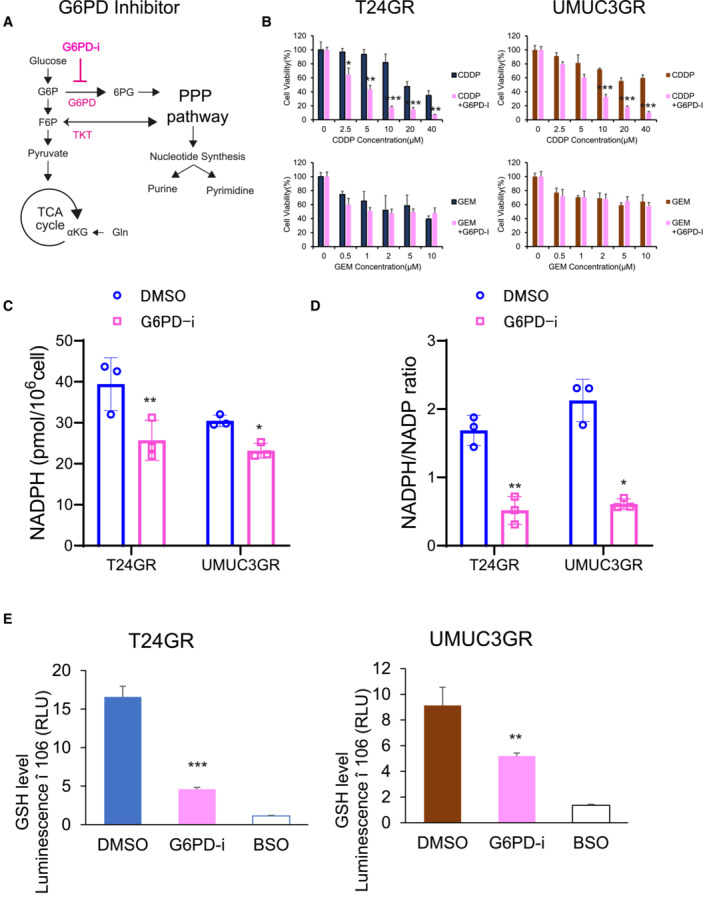
Simple schematic of the glycolytic pathway and the pentose phosphate pathway (PPP). The G6PD inhibitor (G6PD‐i) inhibits the oxidative bypass pathway coupling glycolysis to the PPP.
Bar graph showing the viability of GR cells exposed to various concentrations of CDDP and GEM for 48 h and treated with DMSO or G6PD‐i (10 μM) (left: T24GR, right: UMUC3GR). The data are shown as the mean values ± SDs (n = 3, biological replicates) and were analyzed by Student's t‐test. *P < 0.05, **P < 0.01, ***P < 0.001.
Total NADPH levels in T24GR and UMUC3GR cells after 48 h of exposure to DMSO or G6PD‐i (10 μM). The data are shown as the mean values ± SDs (n = 3, biological replicates) and were analyzed by Student's t‐test. *P < 0.05, **P < 0.01.
NADPH/NADP ratio in T24GR and UMUC3GR cells after 48 h of exposure to DMSO or G6PD‐i (10 μM). The data are shown as the mean values ± SDs (n = 3, biological replicates). Data were analyzed by Student's t‐test and are plotted relative to the levels in DMSO group. *P < 0.05, **P < 0.01.
Intracellular GSH levels in GR cells after 48 h of exposure to DMSO or G6PD‐i (10 μM) (left: T24GR, right: UMUC3GR). The data are shown as the mean values ± SDs (n = 3, biological replicates) and were analyzed by Student's t‐test. **P < 0.01, ***P < 0.001.

