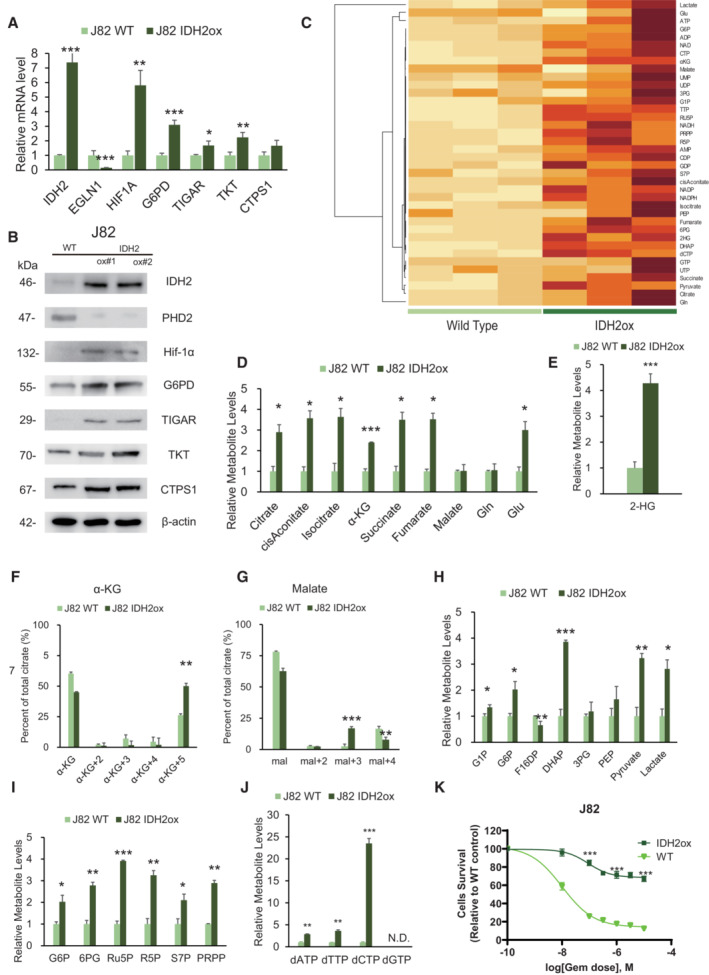
Figure 5. IDH2 overexpression recapitulate metabolic rewiring.

- Relative mRNA expression levels of IDH2, EGLN1, Hif‐1α, G6PD, TIGAR, TKT, and CTPS1 between J82 wild‐type cells (J82WT) and J82 cells with IDH2 overexpression (J82‐IDH2ox cells). The data are shown as the mean values ± SEs (n = 3, biological replicates). The expression levels were analyzed by Student's t‐test and are plotted relative to the expression levels in WT cells. *P < 0.05, **P < 0.01, ***P < 0.001.
- Western blot analysis of IDH2, PHD2, Hif‐1α, G6PD, TIGAR, TKT, CTPS1, and β‐actin in J82WT and J82‐IDH2ox cells.
- Hierarchical clustering of significantly regulated metabolites in J82WT and J82‐IDH2ox cells (n = 3, biological replicates each).
- Levels of intermediate metabolites of the tricarboxylic acid (TCA) cycle based on targeted CE‐MS/MS metabolomics in GR cells relative to WT cells. The data are shown as the mean values ± SDs (n = 3, biological replicates) and were analyzed by Student's t‐test. *P < 0.05, ***P < 0.001.
- Relative 2‐HG production level based on targeted CE‐MS metabolomics in J82‐IDH2ox cells compared with WT cells. The data are shown as the mean values ± SDs (n = 3, biological replicates) and were analyzed by Student's t‐test. ***P < 0.001.
- 13C enrichment in cellular α‐KG, as determined by CE‐MS and normalized to the total pool size of the corresponding metabolite. The data are shown as the mean values ± SDs (n = 3, biological replicates) and were analyzed by Student's t‐test. **P < 0.01.
- 13C enrichment in cellular malate determined by CE‐MS and normalized to the total pool size of the corresponding metabolite. The data are shown as the mean values ± SDs (n = 3, biological replicates) and were analyzed by Student's t‐test. **P < 0.01, ***P < 0.001.
- Major metabolites in the glycolytic pathway altered in J82‐IDH2ox cells compared with WT cells. The data are shown as the mean values ± SDs (n = 3, biological replicates) and were analyzed by Student's t‐test. *P < 0.05, **P < 0.01, ***P < 0.001.
- PPP metabolite levels in J82‐IDH2ox cells compared with WT cells based on targeted CE‐MS metabolomics. The data are shown as the mean values ± SDs (n = 3, biological replicates) and were analyzed by Student's t‐test. *P < 0.05, **P < 0.01, ***P < 0.001.
- Relative dATP, dTTP, and dCTP level based on targeted CE‐MS metabolomics in J82‐IDH2ox cells compared with WT cells. The data are shown as the mean values ± SDs (n = 3, biological replicates) and were analyzed by Student's t‐test. **P ≤ 0.01, ***P ≤ 0.001. N.D., non‐detectable.
- Graph showing the viability of J82WT and J82‐IDH2ox cells exposed to various concentrations of GEM for 48 h. The data are shown as the mean values ± SDs (n = 3, biological replicates) and were analyzed by Student's t‐test. ***P < 0.001.
Source data are available online for this figure.
