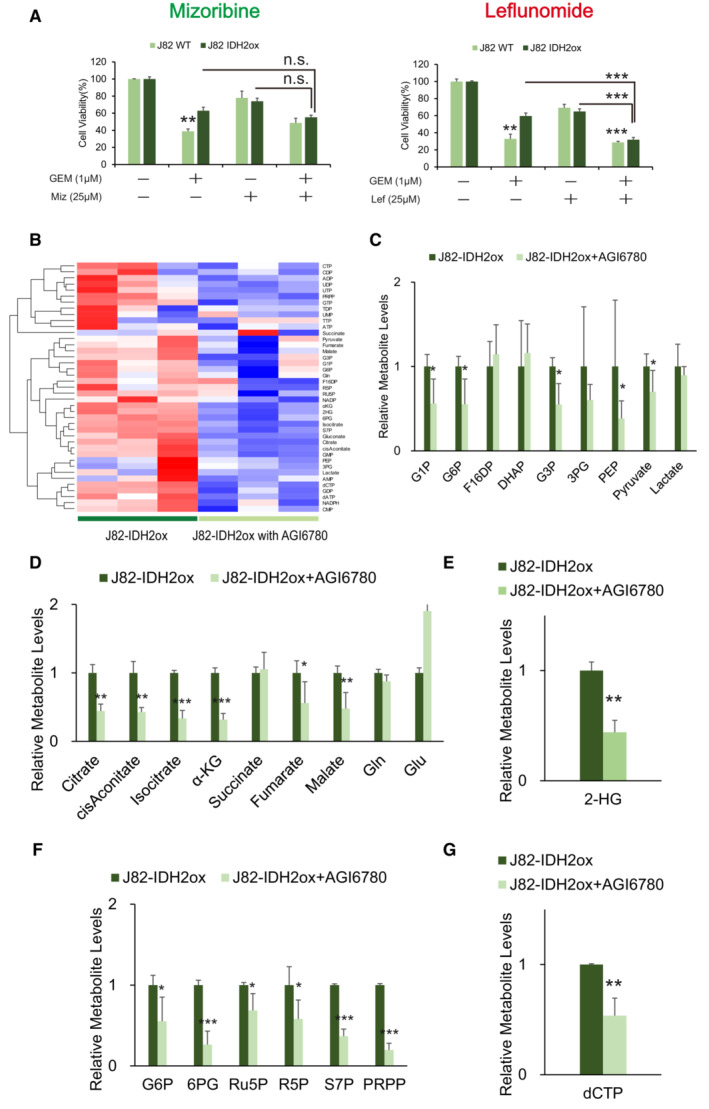
The viability of J82WT and J82‐IDH2ox cells was assessed by WST assays under treatment with GEM, mizorubine, GEM with mizorubine, leflunomide, or GEM with leflunomide. The data are shown as the mean values ± SDs (n = 3, biological replicates). Comparisons were made with respect to the corresponding controls or the indicated groups, followed by analysis with Student's t‐test. **P ≤ 0.01, ***P ≤ 0.001. n.s., non‐significant.
Complete heatmap showing the intracellular levels of metabolites in J82‐IDH2ox cells treated with AGI6780. For each cell line, data for three individual biological replicates are shown, and the levels were normalized to those in J82‐IDH2ox cells.
Major metabolites in the glycolytic pathway altered in J82‐IDH2ox cells treated with AGI6780 compared with untreated J82‐IDH2ox cells. The data are shown as the mean values ± SDs (n = 3, biological replicates). The data are shown as the mean values ± SDs (n = 3, biological replicates) and were analyzed by Student's t‐test. *P < 0.05.
Levels of intermediate metabolites of the tricarboxylic acid (TCA) cycle based on targeted CE‐MS metabolomics in J82‐IDH2ox cells treated with AGI6780 relative to untreated J82‐IDH2ox cells based on targeted CE‐MS metabolomics. The data are shown as the mean values ± SDs (n = 3, biological replicates) and were analyzed by Student's t‐test. *P < 0.05, **P < 0.01, ***P < 0.001.
Relative 2‐HG production level based on targeted CE‐MS metabolomics in J82‐IDH2ox cells treated with AGI6780 compared with untreated J82‐IDH2ox cells. The data are shown as the mean values ± SDs (n = 3, biological replicates) and were analyzed by Student's t‐test. **P < 0.01.
PPP metabolite levels based on targeted CE‐MS metabolomics in J82‐IDH2ox cells treated with AGI6780 relative to untreated J82‐IDH2ox cells. The data are shown as the mean values ± SDs (n = 3, biological replicates) and were analyzed by Student's t‐test. *P < 0.05, ***P < 0.001.
Relative dCTP level based on targeted CE‐MS metabolomics in J82‐IDH2ox cells treated with AGI6780 compared with untreated J82‐IDH2ox cells. The data are shown as the mean values ± SDs (n = 3, biological replicates) and were analyzed by Student's t‐test. **P < 0.01.

