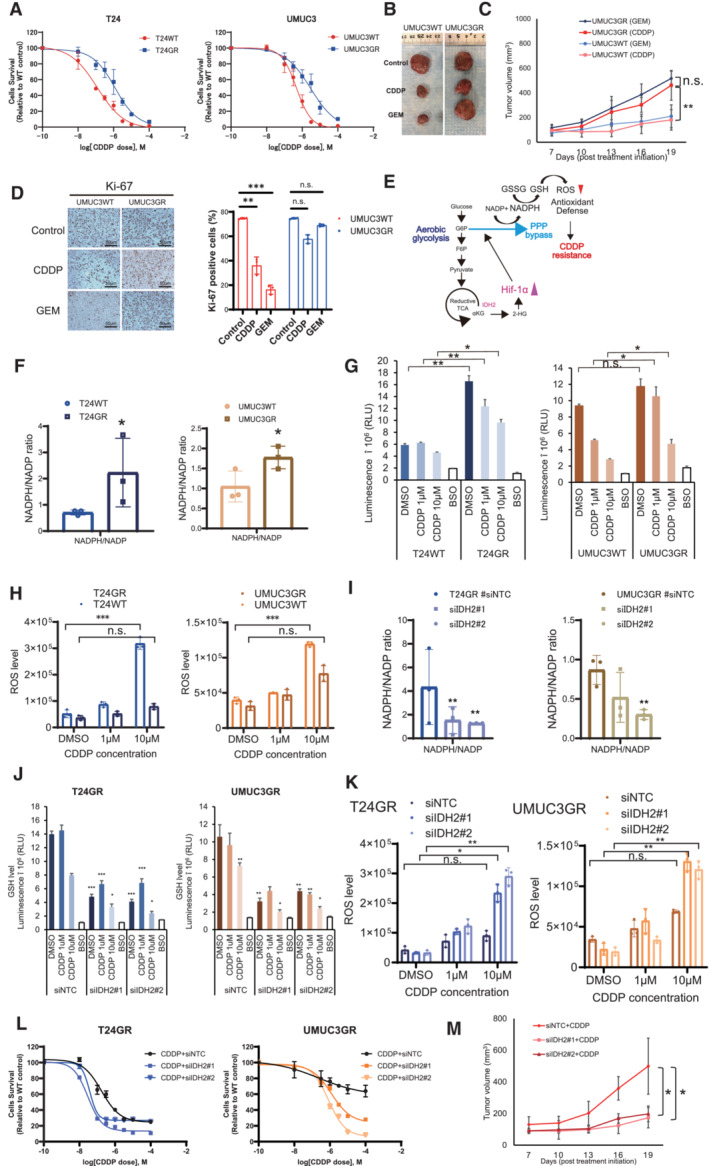
Changes in cytotoxicity between WT and GR T24 and UMUC3 cells exposed to increasing concentrations of CDDP for 48 h. The data are shown as the mean values ± SDs (n = 3, biological replicates).
Representative image showing the effect of CDDP in GR xenograft UC mouse models.
Graph showing the cytotoxic effect of CDDP and GEM in WT and GR cells orthotopically implanted mouse models (n = 5 mice per group). UMUC3GR cells (2 × 10⁶ cells) were implanted subcutaneously into the flanks of nude mice. After 1 weeks of implantation, the groups were treated with GEM (i.p. injection of 50 mg/kg weekly) or CDDP (intraperitoneal injection of 15 mg/kg on weekly). The mean growth of tumor volume (mm3) ± SD for each group is shown. Data were analyzed by Student's t‐test. **P < 0.01. n.s., non‐significant.
Immunohistochemistry (IHC) staining of Ki‐67 in UMUC3WT and GR cells exposed to CDDP/GEM. Ki‐67 staining quantitation of UMUC3WT and UMUC3GR cells exposed to CDDP/GEM are shown as bar graph The data are shown as the mean values ± SDs (n = 3, biological replicates) and were analyzed by one‐way ANOVA with the Bonferroni test. **P < 0.05, ***P < 0.001. n.s., non‐significant.
Schematic of the mechanism by which GR UC cells acquire an antioxidant defense. Bypass of the oxidative PPP via aerobic glycolysis is suspected to be responsible for increased NADPH production. The increased NADPH leads to an increase in the GSH level. The increase in the GSH level decreases ROS generation and leads to the acquisition of cross‐resistance to CDDP.
NADPH/NADP ratios in WT and GR cells. The data are shown as the mean values ± SDs (n = 3, biological replicates) and were analyzed by Student's t‐test. *P < 0.05.
Intracellular GSH levels in WT and GR cells after 24 h of exposure to the DMSO, CDDP (1 μM and 10 μM). The data are shown as the mean values ± SDs (n = 3, biological replicates) and were analyzed by Student's t‐test. *P < 0.05, **P < 0.01. n.s., non‐significant.
Intracellular ROS generation in WT and GR cells after 24 h of exposure to CDDP (1 and 10 μM). The data are shown as the mean values ± SDs (n = 3, biological replicates) and were analyzed by Student's t‐test. ***P < 0.001. n.s., non‐significant.
NADPH/NADP ratios of GR cells transfected with NTC, IDH2 siRNA#1, and siRNA#2 (left: T24GR, right: UMUC3GR). The data are shown as the mean values ± SDs (n = 3, biological replicates) and were analyzed by Student's t‐test. **P < 0.01.
Intracellular GSH levels in GR cells transfected with NTC, IDH2 siRNA#1, and siRNA#2 (left: T24GR, right: UMUC3GR). The data are shown as the mean values ± SDs (n = 3, biological replicates) and were analyzed by Student's t‐test. *P < 0.05, **P < 0.01, ***P < 0.001.
ROS generation levels in GR cells transfected with NTC, IDH2 siRNA#1, and siRNA#2 (left: T24GR, right: UMUC3GR). The data are shown as the mean values ± SDs (n = 3, biological replicates) and were analyzed by Student's t‐test. *P < 0.05, **P < 0.01. n.s., non‐significant.
Graph shows the viability of WT and GR cells exposed to various concentrations of GEM for 48 h after transfection with NTC, IDH2 siRNA#1, and siRNA#2 (left: T24GR, right: UMUC3GR). The data are shown as the mean values ± SDs (n = 3, biological replicates).
Treatment in vivo using orthotopically implanted mouse models (n = 5 mice per group). We implanted UMUC3GR cells (2 × 10⁶ cells) transfected with #siNTC for 48 h, UMUC3GR cells (2 × 10⁶ cells) transfected with siIDH2#1 and siIDH2#2 for 48 h, and then injected subcutaneously into the flank of each BALB/c‐nu/nu mice. One week after implantation, cells were treated with CDDP (i.p. injection of 15 mg/kg weekly). The mean tumor volume (mm3) ± SD for each group is shown. Data were analyzed by Student's t‐test. *P < 0.05.

