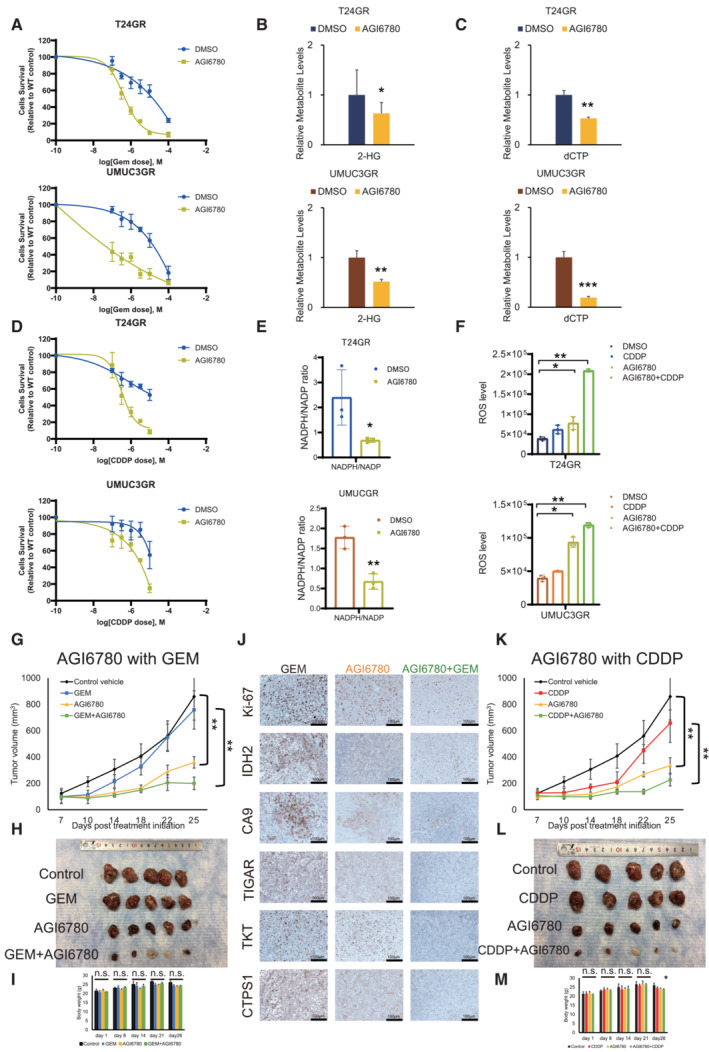
Figure 7. AGI6780 restores chemosensitivity in chemo‐resistant UC cells.

- Graph showing the viability of GR cells exposed to various concentrations of GEM for 48 h in combination with DMSO or 10 μM AGI6780 (upper: T24GR, lower: UMUC3GR). The data are shown as the mean values ± SDs (n = 3, biological replicates).
- Relative 2‐HG production level based on targeted CE‐MS metabolomics in GR cells exposed to DMSO or 10 μM AGI6780 for 24 h (upper: T24GR, lower: UMUC3GR). The data are shown as the mean values ± SDs (n = 3, biological replicates) and were analyzed by Student's t‐test. *P < 0.05, **P < 0.01.
- Relative dCTP level based on targeted CE‐MS metabolomics in GR cells exposed to DMSO or 10 μM AGI6780 for 24 h (upper: T24GR, lower: UMUC3GR). The data are shown as the mean values ± SDs (n = 3, biological replicates) and were analyzed by Student's t‐test. **P < 0.01, ***P < 0.001.
- Graph showing the viability of GR cells exposed to various concentrations of CDDP for 48 h in combination with DMSO or 10 μM AGI6780 (upper: T24GR, lower: UMUC3GR). The data are shown as the mean values ± SDs (n = 3, biological replicates).
- NADPH/NADP ratio in GR cells exposed to DMSO or 10 μM AGI6780 for 24 h. The data are shown as the mean values ± SDs (n = 3, biological replicates). The data were analyzed by Student's t‐test (upper: T24GR, lower: UMUC3GR). *P < 0.05, **P < 0.01.
- Intracellular ROS generation in GR cells exposed to DMSO or 10 μM AGI6780 for 24 h. The data are shown as the mean values ± SDs (n = 3, biological replicates). The data were analyzed by Student's t‐test (upper: T24GR, lower: UMUC3GR). *P < 0.05, **P < 0.01.
- In vivo treatment of orthotopically implanted mouse models (n = 5 mice per group). UMUC3GR cells (2 × 10⁶ cells) were implanted subcutaneously into the flanks of nude mice. One week after implantation, the groups were treated with GEM alone (i.p. injection of 50 mg/kg weekly), AGI6780 alone (i.p. injection of 50 mg/kg daily), or a combination of GEM and AGI6780 (i.p. injection of 50 mg/kg GEM weekly and i.p. injection of 50 mg/kg AGI6780 daily). The mean tumor volume (mm3) ± SD for each group is shown. Data were analyzed by Student's t‐test. **P < 0.01.
- Representative images of tumors upon necropsy.
- Body weights of mice with the indicated treatments. The data are shown as the mean values ± SDs (n = 5 mice per group), and were analyzed by Student's t‐test. n.s. = non‐significant.
- IHC staining for IDH2, Ki‐67, CAIX, TIGAR, TKT, and CTPS1 in groups with GEM alone, AGI6780 alone, and the combination of GEM and AGI6780.
- In vivo treatment of orthotopically implanted mice (n = 5 mice per group). UMUC3GR cells (2 × 10⁶ cells) were implanted subcutaneously into the flanks of nude mice. One week after implantation, the groups were treated with CDDP alone (weekly i.p. injection of 15 mg/kg), AGI6780 alone (daily i.p. injection of 50 mg/kg), or a combination of GEM and AGI6780 (weekly i.p. injection of 15 mg/kg CDDP and daily i.p. injection of 50 mg/kg AGI6780). The tumor volume (mm3, mean ± SD) in for each group is shown. Data were analyzed by Student's t‐test. **P < 0.01.
- Representative images of tumors upon necropsy.
- Body weights of mice treated as indicated. The data are shown as the mean values ± SDs (n = 5 mice per group) and were analyzed by Student's t‐test. n.s. = non‐significant.
Source data are available online for this figure.
