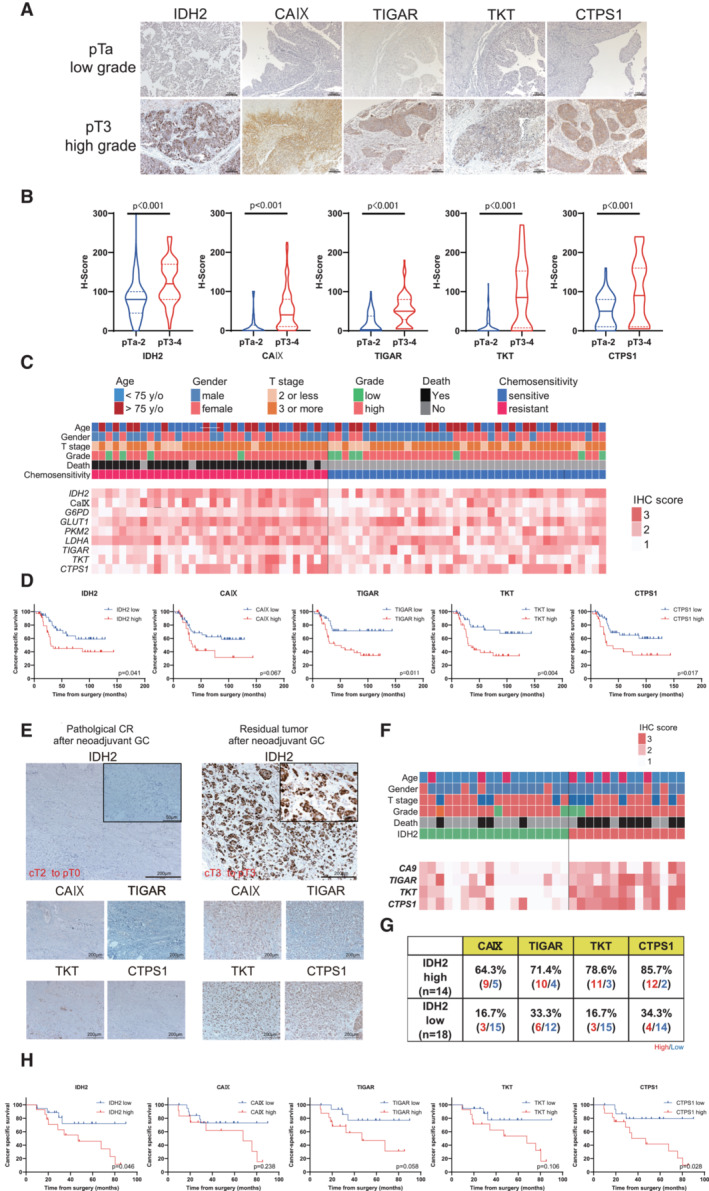
Representative immunostaining of IDH2, CAIX (surrogate marker of Hif‐1α), TIGAR, TKT, and CTPS1 in surgical specimens from upper tract urothelial carcinoma (UTUC) patients. The upper panel represents the immunostaining of metabolic enzymes of early‐stage UTUC tumors, whereas the lower panel represents the images of invasive UTUC tumors. The power field scale bar = 100 μm.
Comparison of histoscores (H‐scores) for each metabolic enzyme divided by early‐ or advanced‐stage tumors. The H‐score was calculated by applying the following formula: mean percentage × intensity (range, 0–300). Violin plots were divided by pTa‐2: 116 UC patients and pT3‐4: 98 UC patients. Data were analyzed by Student's t‐test.
Heat map describing the IHC score in UTUC patients treated with GEM and CDDP (GC) adjuvant chemotherapy (n = 74). The heat map of metabolic enzymes in patients was classified by chemo‐sensitivity with information for age, sex, pT stage, grade, and death.
Kaplan–Meier curves showing the cancer‐specific survival (CSS) of 74 UTUC patients treated with GC adjuvant chemotherapy. Metabolic enzymes were classified according to the results of receiver operating curve (ROC) analysis. Data were compared with the log‐rank test.
Representative immunostaining of IDH2, CAIX, TIGAR, TKT, and CTPS1 in surgical specimens from muscle invasive urothelial carcinoma (MIBC) patients with neoadjuvant GC chemotherapy. Case 1 was a transurethral resection of bladder tumor (TURBT) specimen that induced a pathological complete response (pT0) in a radical cystectomy (RC) specimen. Case 2 was indicated as residual pT3 after neoadjuvant GC therapy. The power field scale bars = 200 and 50 μm.
Heat map describing the IHC score in MIBC patients treated with GC chemotherapy (n = 32). The heat map of metabolic enzymes in patients classified by IDH2 expression with information for age, sex, pT stage, grade, and death.
Details of high and low expression of CAIX, TIGAR, TKT, and CTPS1 classified with IDH2 expression.
Kaplan–Meier method showing the CSS of 32 MIBC patients treated with GC chemotherapy. The cutoffs for metabolic enzyme levels were determined according to the results of ROC analysis. Data were compared with the log‐rank test.

