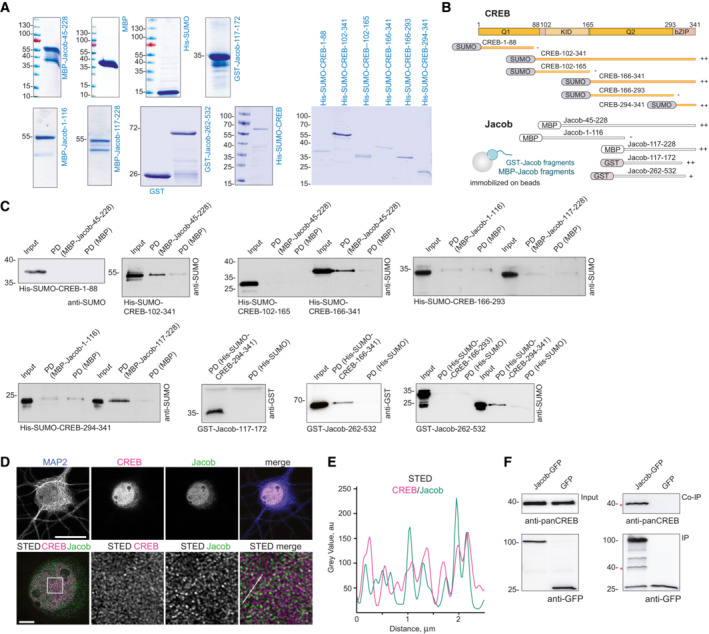
Figure EV2. Mapping of the binding interfaces between Jacob and cAMP‐responsive element‐binding protein (CREB).

-
ACoomassie blue staining depicting the purity of bacterially produced proteins used for pull‐down assays between CREB and Jacob.
- B
-
CThe N‐terminus of Jacob (117‐172 aa in red) interacts with the bZIP domain of CREB, but not with the Q1 (1‐88 aa), KID (102‐165 aa), or Q2 (166‐293 aa) domain. The C‐terminus of Jacob (262‐532 aa) shows weaker binding to the bZIP domain of CREB. Images of immunoblots representing pull‐down assays performed with Jacob and CREB protein fragments depicted in the panel (B).
-
D, EConfocal and STED images show an association of CREB with Jacob in the nucleus of DIV16 hippocampal primary neurons. (D) The upper panel represents deconvolved confocal images. Lower panels depict deconvolved STED images. Scale bars: 20 and 5 μm, respectively. Inserts are denoted by a white square. (E) Line profiles indicate the overlap of relative intensities for CREB and Jacob along a 2.5 μm line.
-
FEndogenous CREB co‐immunoprecipitate with overexpressed Jacob‐GFP, but not GFP from HEK293T cell extracts. The asterisk denotes the CREB band from a membrane subsequently re‐probed with an anti‐GFP antibody.
Source data are available online for this figure.
