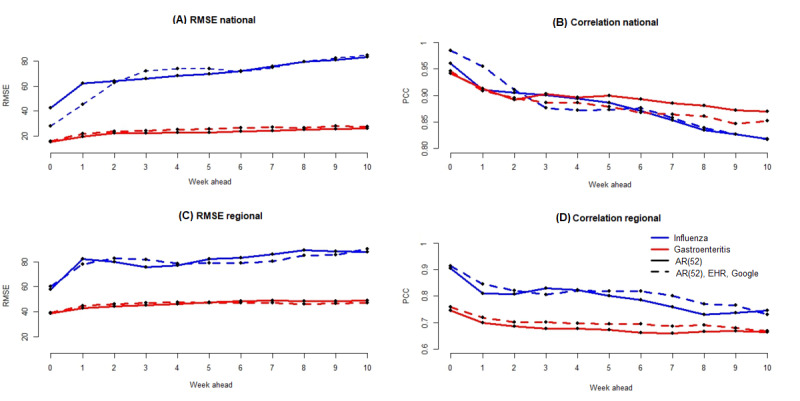
Figure 9.

(A) Error values obtained at the national level for the flu and gastroenteritis for forecasts up to 10 weeks with the RF model. The solid line corresponds to the results obtained with the random forest (RF) model using only historical data. The dotted line corresponds to the results obtained with the RF model using historical data and both Google and EHR data. The red color is the results for gastroenteritis disease, whereas the blue color is the results for the flu. This style line and color code are used for the 4 panels of this figure. (B) Correlation values obtained at the national level. (C) Error values obtained at the regional level. (D) Correlation values obtained at the regional level. EHR: electronic health record.
