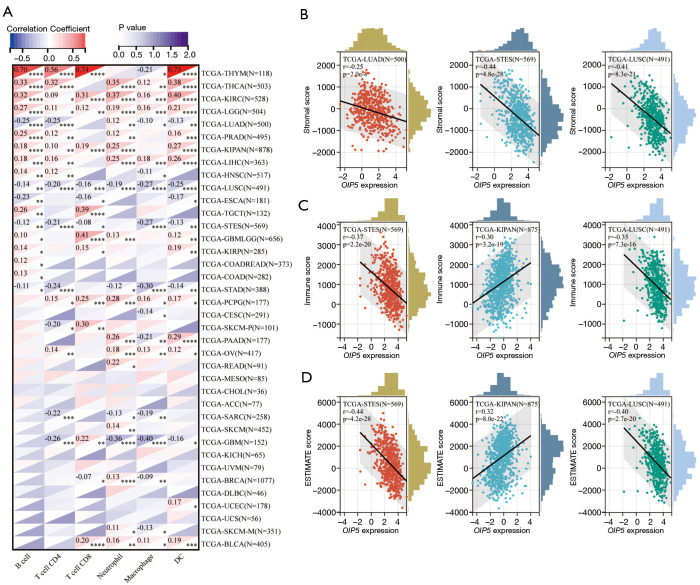
Figure 7.
Correlations between OIP5 expression and tumor-infiltrating immune cells and tumor microenvironment indicators. (A) Results of pan-cancer correlation analysis between OIP5 expression and B cells, CD4+ T cells, CD8+ T cells, neutrophils, macrophages, and dendritic cells. Representative results of correlation analysis between OIP5 expression and the (B) stromal, (C) immune, and (D) ESTIMATE scores. *, P<0.05; **, P<0.01; ***, P<0.001; ****, P<0.0001. TCGA, The Cancer Genome Atlas; ESTIMATE, Estimation of STromal and Immune cells in MAlignant Tumors using Expression data.

