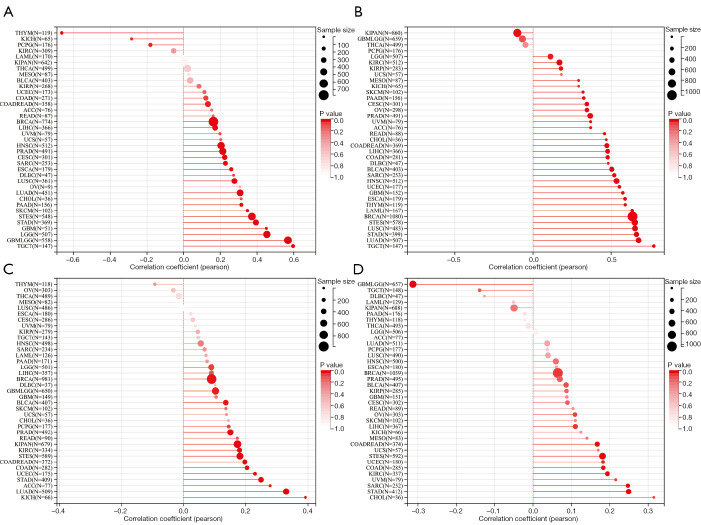
Figure 9.
Correlations of OIP5 expression levels with DNA methylation-based stemness score, mRNA expression-based stemness score, tumor mutational burden, and microsatellite instability. Bubble chart of the correlations between OIP5 expression and (A) DNA methylation-based stemness score, (B) mRNA expression-based stemness score, (C) tumor mutational burden, and (D) microsatellite instability.

